Hawai‘i’s Most Profitable Companies
This ranking based on 2018 financial results shows a familiar company at the top

This year marks the ninth anniversary of Hawaii Business Magazine’s Most Profitable Companies list, and First Hawaiian Bank is at the top for the eighth time. FHB also had this year’s highest profit margin at just over 32% of its gross annual sales during 2018.
Last year’s biggest profit producer, Hawaiian Airlines, came in second and earned a net profit of $233.2 million during 2018, more than $30 million behind FHB’s profit of $264.4 million.
Hawaiian Telcom lost more than $100 million in 2017 but was back on track with $7 million in profit last year. Kaiser Permanente Hawaii also reported a sizable deficit on our previous list (around $25 million) but ended its last fiscal year with almost $30 million in net revenue.
Every year, Hawaii Business Magazine asks participants in our Top 250 survey (August issue) to self-report net profits or losses using the generally accepted accounting principles for their industries. Because nonprofit entities do not earn money in the same way as private businesses, we define their “profit” figures as the surplus of revenue over yearly expenses.
Some organizations do not submit this information, so Hawaii Business Magazine researchers review publicly available records like annual financial reports and federal regulatory filings to provide a more complete picture of the state of business in Hawai‘i. The companies we investigated are denoted with two asterisks in the list below.
| Profit Rank 2019 | Profit Rank 2018 | Top 250 Rank 2019 | Company Name | Gross Annual Sales (2018) | Net Profit/Loss (2018) | Profit as a Percentage of Revenue |
|---|---|---|---|---|---|---|
| 1 | 5 | 13 | First Hawaiian Bank | 825,044,000 | 264,394,000 | 32.05% |
| 2 | 1 | 3 | Hawaiian Airlines | 2,837,411,000 | 233,200,000 | 8.22% |
| 3 | 4 | 14 | Bank of Hawaii Corp. | 719,096,000 | 219,602,000 | 30.54% |
| 4 | 6 | 2 | Hawaiian Electric Industries Inc. | 2,860,849,000 | 201,774,000 | 7.05% |
| 5 | 7 | 11 | Hawai‘i Pacific Health * | 1,351,833,645 | 111,214,696** | 8.23% |
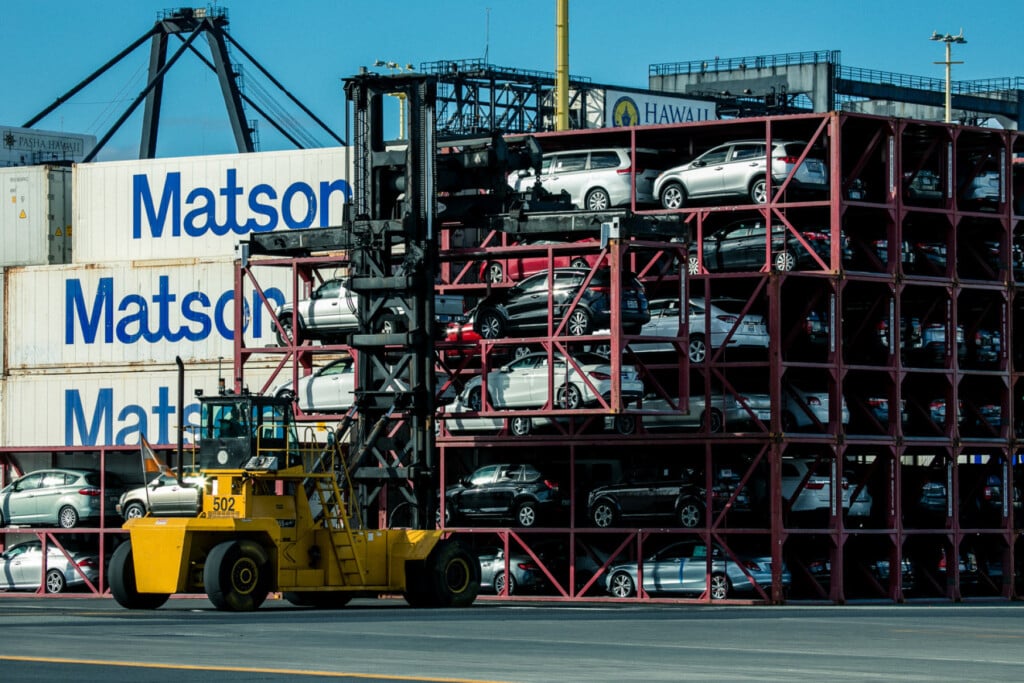
| 6 | 2 | 5 | Matson Inc. | 2,222,800,000 | 109,000,000 | 4.90% |
| 7 | N/A | 34 | American Savings Bank | 298,628,000 | 82,509,000 | 27.63% |
| 8 | 10 | 1 | Hawaii Medical Service Association (HMSA) * | 3,803,542,986 | 68,895,000** | 1.81% |
| 9 | 11 | 47 | Central Pacific Financial Corp. | 211,802,000 | 59,486,000 | 28.09% |
| 10 | 12 | 6 | University of Hawai‘i * | 1,858,823,000 | 51,946,000** | 2.79% |
| 11 | 9 | 44 | Honolulu Board of Water Supply * | 232,377,848 | 46,232,576** | 19.90% |
| 12 | 53 | 9 | Kaiser Permanente Hawaii * | 1,675,235,883 | 29,169,342 | 1.74% |
| 13 | 13 | 30 | UHA Health Insurance (University Health Alliance) | 327,882,159 | 28,684,463** | 8.75% |
| 14 | N/A | 37 | Island Palm Communities LLC | 264,660,000 | 27,390,000 | 10.35% |
| 15 | N/A | 38 | First Insurance Company of Hawaii Ltd. | 255,400,000 | 21,200,000 | 8.30% |
| 16 | 15 | 102 | Territorial Savings Bank | 76,465,000 | 19,212,000 | 25.13% |
| 17 | 21 | 25 | JTB Hawaii Inc. | 444,657,000 | 12,016,000 | 2.70% |
| 18 | N/A | 105 | Hawaii State Federal Credit Union * | 74,077,148 | 9,838,264 | 13.28% |
| 19 | 19 | 115 | HawaiiUSA Federal Credit Union * | 62,452,285 | 9,716,921** | 15.56% |
| 20 | 22 | 56 | Kaua‘i Island Utility Cooperative * | 162,659,638 | 8,432,528 | 5.18% |
| 21 | 54 | 29 | Hawaiian Telcom | 351,398,000 | 7,791,000 | 2.22% |
| 22 | N/A | 154 | Aloha Pacific Federal Credit Union * | 35,193,180 | 5,643,919 | 16.04% |
| 23 | 25 | 41 | Tony Group | 237,800,000 | 5,223,000 | 2.20% |
| 24 | N/A | 111 | Hawaii Employers’ Mutual Insurance Co. Inc. | 67,237,063 | 4,324,447 | 6.43% |
| 25 | N/A | 202 | Pearl Hawaii Federal Credit Union * | 16,205,305 | 4,265,238 | 26.32% |
| 26 | 32 | 181 | Finance Factors Ltd. | 22,065,000 | 4,137,000 | 18.75% |
| 27 | N/A | 138 | Honolulu Builders LLC | 47,200,000 | 3,400,000 | 7.20% |
| 28 | 38 | 188 | Pohai Nani Retirement Community * | 20,259,011 | 3,267,356 | 16.13% |
| 29 | 23 | 218 | Maui County Federal Credit Union * | 10,777,869 | 3,244,337** | 30.10% |
| 30 | 27 | 172 | Aqua Engineers Inc. | 27,000,000 | 3,000,000 | 11.11% |
| 31 | 31 | 104 | Pflueger Group | 75,243,385 | 2,503,303 | 3.33% |
| 32 | N/A | 28 | AlohaCare * | 372,746,000 | 2,412,496 | 0.65% |
| 33 | N/A | 176 | Atlas Insurance Agency Inc. | 25,060,000 | 2,077,000 | 8.29% |
| 34 | N/A | 169 | Catholic Charities Hawai‘i | 27,375,954 | 1,952,342 | 7.13% |
| 35 | 35 | 185 | Hickam Federal Credit Union * | 21,072,268 | 1,768,830 | 8.39% |
| 36 | N/A | 225 | Express Employment Professionals | 8,728,144 | 1,463,516 | 16.77% |
| 37 | 20 | 163 | YMCA of Honolulu * | 31,571,000 | 1,458,000 | 4.62% |
| 38 | N/A | 109 | RAM Corporation | 68,205,000 | 1,415,000 | 2.07% |
| 39 | N/A | 237 | House of Finance Inc. | 4,700,000 | 1,100,000 | 23.40% |
| 40 | N/A | 213 | Anthology Marketing Group Inc. | 13,340,000 | 970,000 | 7.27% |
| 41 | N/A | 162 | Pacxa | 31,800,000 | 952,000 | 2.99% |
| 42 | N/A | 165 | Child & Family Service | 30,540,000 | 940,000 | 3.08% |
| 43 | 28 | 48 | Hawaii Medical Assurance Association (HMAA) | 207,000,000 | 735,000 | 0.36% |
| 44 | 49 | 168 | Kama‘āina Kids * | 27,937,912 | 665,336 | 2.38% |
| 45 | 18 | 216 | Maui Land & Pineapple Co. Inc. * | 11,037,000 | 498,000** | 4.51% |
| 46 | 44 | 219 | Hawaii Central Federal Credit Union * | 10,645,341 | 411,485 | 3.87% |
| 47 | N/A | 247 | Sachi Hawaii Pacific Century Properties LLC | 2,910,460 | 397,240 | 13.65% |
| 48 | N/A | 228 | Maui Plumbing Inc. | 8,043,369 | 321,574 | 4.00% |
| 49 | 43 | 211 | Employers Options | 14,140,366 | 306,164 | 2.17% |
| 50 | 50 | 245 | T&T Tinting Specialists Inc. | 3,738,000 | 98,401 | 2.63% |
| 51 | N/A | 239 | Staffing Solutions of Hawaii Inc. | 4,601,370 | 95,200 | 2.07% |
| 52 | N/A | 229 | Bishop & Company Inc. | 7,307,042 | 15,279 | 0.21% |
| 53 | 3 | 18 | Alexander & Baldwin Inc.* | 644,400,000 | -69,800,000** | -10.83% |
*Nonprofits, not for profits, public or government agencies | **Company data attained through research, other companies submitted data to Hawaii Business


