Honolulu: Late and Last

When you look at Hawaii’s biggest problems, it’s astounding how many are tied to our housing shortage. Nationally, we’re near the top in cost of living, price of housing, homelessness and time spent in traffic. And we’re near the
bottom in disposable income, hours of sleep a night and percentage of two-income families.
ELASTICITY
 This connection was highlighted recently in a fascinating report by Ralph McLaughlin, the chief economist for the real estate website Trulia.com. McLaughlin’s study looks at the relationship between changes in housing prices and the production of new homes.
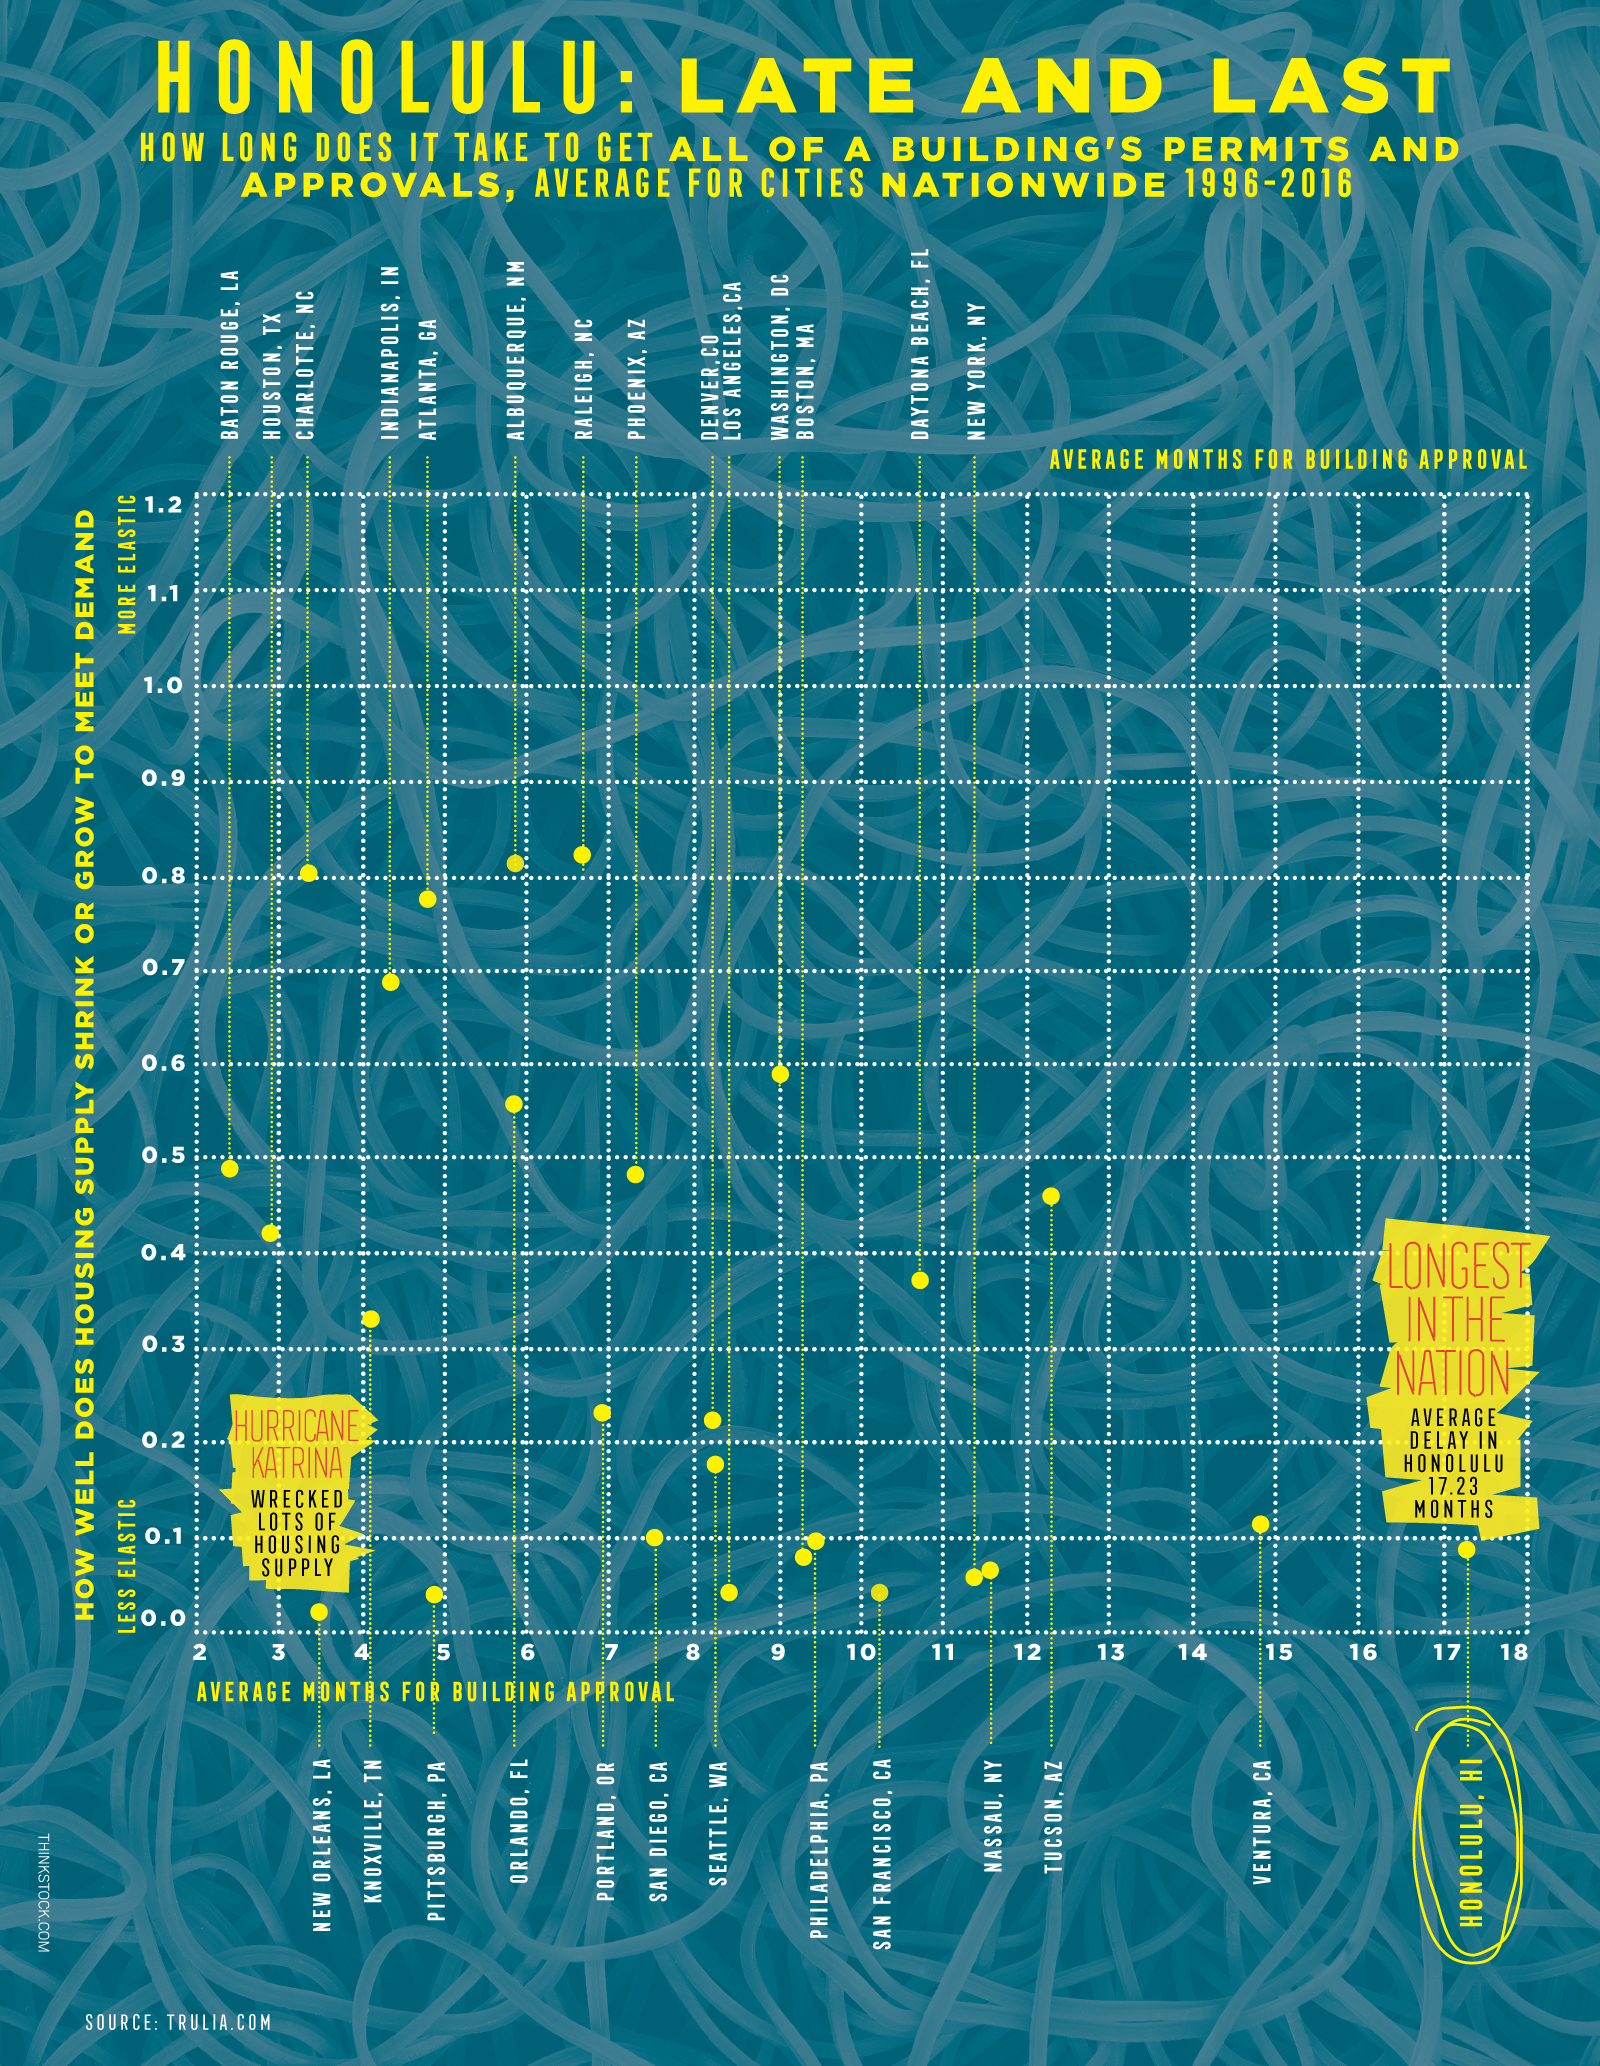
He compares major municipalities to see how quickly developers responded to increases in home prices over the past 20 years. The economic term for this relationship is “elasticity of supply,” and is measured by dividing the percentage change in available housing by the percentage change in the average price of a home. In a perfectly elastic market, if the price of housing increases 1 percent, the supply also increases 1 percent, yielding an elasticity index of 1. Needless to say, Honolulu’s housing market is very inelastic.
In fact, once again, Honolulu is near the bottom. According to McLaughlin’s calculations, Honolulu’s score of 0.09 on the elasticity index ranks 86th out of 101 cities. From 1996 to 2006, Honolulu home prices increased 146 percent, but the supply of housing units only went up 12.6 percent. That’s why the cost of housing outstrips the purchasing power of most Hawaii residents.
What causes this persistent inelasticity? Almost everyone in Hawaii’s construction and development community gives the same answer: zoning and regulation run amok. In fact, it appears obvious that fewer homes will get built if city ordinances, such as height restrictions and lot setbacks, make it harder and costlier to build them. As McLaughlin puts it, “Building 100 new homes on a lot is difficult to do if it is only zoned for 50.”
If you look at the markets Honolulu most resembles, the link between land-use restrictions and elasticity seems even clearer. Many cities with the worst elasticity of supply are clustered on the West Coast and in the upper Northeast. Several, like San Francisco, New York and Boston, are geographically constrained by water, so there isn’t much room to build new housing. They’re also politically liberal cities that are considered highly regulated, much like Honolulu. In contrast, the cities that had the highest elasticity of supply – places like Miami, Phoenix and, especially, Las Vegas – are typically in flat regions with plenty of inexpensive land and few zoning or housing restrictions. The study seemed to indicate that excessive regulation reduces the elasticity of demand, but the truth turned out to be both more complicated and simpler.
ZONING RESTRICTIONS
 To understand why, let’s look closely at what we mean by “excess land regulation.” For his Trulia.com report, McLaughlin relies on a 2008 study by Christopher Mayer and C. Tsuriel Somerville of the University of Pennsylvania’s Wharton School of Business. That study measured land use regulations in different cities. The Wharton Residential Land Use Regulatory Index is a sliding scale that considers 11 policies or regulatory procedures that complicate the zoning and entitlement process. The higher a city is on the Wharton Index, the more restrictive its land-use regulations.
Many of the underlying components of the Wharton Index are disturbingly familiar to Honolulu developers:
ο Local Political Pressure Index measures involvement of local councils, community groups and the Legislature in managing growth.
ο State Political Involvement Index looks at the degree the executive and legislative branches affect land-use restrictions.
ο State Court Involvement Index scores each city by the tendency of the appellate courts to uphold restrictive zoning.
ο Local Zoning Approval Index tallies the entities that have to approve a zoning change.
ο Local Project Approval Index counts the entities that have to approve a project that doesn’t need a zoning variance.
ο Local Assembly Index accounts for community participation in the land-use process.
ο Supply Restriction Index reflects how much the city caps the permits on new buildings.
ο Density Restrictions Index measures the impact of policies like minimum lot sizes.
ο Exactions Index considers the extent to which developers must pay for things like infrastructure improvements and amenities.
ο Approval Delay Index simply measures the average time it takes to go through the full approval process.
 It’s easy to see how any of the sub-indexes that make up the Wharton Index could limit a city’s ability to add new homes. Some indexes seem to focus specifically on failings in the Honolulu market. For example, because Honolulu is one of the few cities that contends with both a county regulatory board and a state Land Use Commission, our Local Zoning Approval Index and State Political Involvement Index are both high. Similarly, the prevalence of laws protecting Native Hawaiian rights, and a State Supreme Court that upholds these laws, raises Honolulu’s State Court Involvement Index and Local Political Pressure Index. Our overall Wharton Index score of 2.32 makes Honolulu the most highly regulated city in the country, far exceeding the next highest score of 1.79 for Providence, Rhode Island.
Yet, McLaughlin’s analysis suggests that restrictive land use regulation, in itself, isn’t the cause for a low elasticity of supply. That’s because zoning restrictions almost always include a process for developers to secure a variance.
“Yes, we have zoning,” says McLaughlin. “And, yes, it can be restrictive. But by its very nature, zoning can almost always be changed. In every single municipality that we looked at, there was a procedure for that. We, as a society, recognize that it should not be the responsibility of the city to forecast what the future housing market will be. So, it has to be able to make changes.”
So, McLaughlin looked deeper into the statistics to see which of the 10 specific indexes in the overall Wharton Index had the most impact on elasticity. What he found is so mundane that it’s surprising.
The only sub-index that correlated in a statistically meaningful way with a city’s elasticity of supply was its Approval Delay Index – how long it takes on average for a developer to go from the beginning of the zoning approval process until the project is fully permitted and entitled. Not only does the Approval Delay Index serve as a good predictor of elasticity, it accounts for the development community’s intuition that Honolulu is a special case. Nationally, the average time to obtain full permitting and entitlements for a project is 6.09 months. On Oahu, it is 17.23 months. Next longest is Ventura County, California, at 14.79 months.
In his Trulia report, McLaughlin calculates that every month of delay in the approval process corresponds to a 0.03 decrease in housing elasticity. “For example,” he writes, “over half of the 0.68 difference in supply elasticity between Honolulu (elasticity of 0.09) and Atlanta (elasticity of 0.77) can be explained by approval delays.”
In other words, Atlanta’s relatively healthy housing market is proportional to the speed with which its planning department approves new development. Or, as McLaughlin says, Honolulu’s problem isn’t zoning regulation; it’s bureaucracy.
A BETTER FUTURE
 You won’t find any disagreement with McLaughlin from Art Challacombe, deputy director at the Department of Planning and Permitting for the City and County of Honolulu.
“I really liked the Trulia article,” Challacombe says. “I found it both compelling and scholarly.”
He says its findings coincide with his own experience, both as a professional land-use planner, and as someone who has had to interact personally with permitting agencies. When he was younger, he and his wife moved to Vero Beach, Florida, for several years because they couldn’t afford a home in Hawaii.
“Essentially we built our first home there,” he says. “We were young and didn’t have a lot of money, but we found the regulations in Indian River County were easy to work with. Basically, we were able to take a completely vacant lot, without any infrastructure, except for electricity, and build a house. Try to do that on Oahu.”
Challacombe says the problem in Honolulu – the reason it takes an average of 17.23 months to get a building permitted – isn’t because of any specific zoning restriction at the county level; it’s because of the layers of regulation a developer must go through.
McLaughlin agrees. “That’s important,” he says. “Places where local governments are regulatory dense probably have a longer time horizon for permitting.” And Oahu has regulatory density in spades: Special Management Areas; Special Design Districts, like Haleiwa and Waikiki; and, especially, the state Land Use Commission.
Challacombe uses the examples of the Koa Ridge and Hoopili housing developments.

Image: Thinkstock.com
“There were lawsuits by community groups and environmental organizations fighting the development of both projects – ‘Keep the Country Country’ – even though both areas had been designated for years as being within the city’s urban growth boundary. These lawsuits essentially stopped and held back development. And it all happened at the Land Use Commission.”
Challacombe’s criticism of the commission – and the Land Use Ordinance that launched it – is multifaceted. He says its roots can be found in the Comprehensive Zoning Code, which was adopted in 1969.
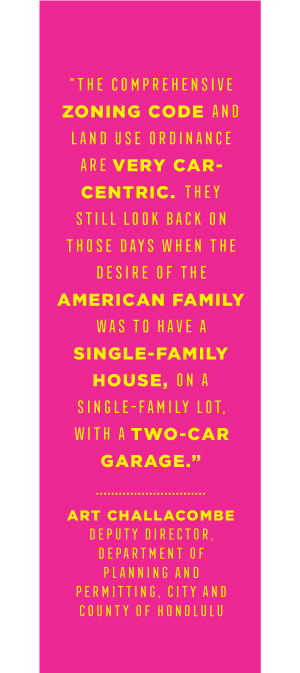
“If you think of 1969,” he says, “what were the land-use patterns? What were the marketing strategies and priorities for housing? It was essentially 1968 Mililani Town. Basically, the Comprehensive Zoning Code and Land Use Ordinance are very car-centric. They still look back on those days when the desire of the American family was to have a single-family house, on a single-family lot, with a two-car garage. That was the American Dream.”
The Comprehensive Zoning Code and, to a large extent, the Land Use Ordinance, still reflect that earlier vision of America. But our goal today is not sprawl, it’s higher-density urban development, fewer cars, multiuse permitting and better mass transit. The Land Use Ordinance is no longer relevant, Challacombe says.
“This department has, for many, many years, advocated to the state that the Land Use Commission has served its purpose and should be abolished. That’s the takeaway I want to give. Again, if we go back to the Wharton study, one of its measures was the State Political Involvement Index, which was a measure of state influence on municipal land-use regulation. So, while there are some things we can’t control, there are some we can. Doing away with the Land Use Commission is one thing we can control. It would certainly save time.”
Happily, even a slight improvement could make a difference. A 10 percent reduction in Honolulu’s average approval time for new housing developments would nearly double the city’s elasticity of supply. That would vault us from near the bottom among American cities into the ranks of mediocrity. One step at a time.


