Hawaiian Values
Robert Howe has been playing the markets since he was in high school. In 1973, he inherited $5,000 from his aunt and his father suggested he buy stock with the windfall. Howe chose a young consumer-products company called Radio Shack. “Over the next decade,” he says, “the stock went up 20-fold, even while the market as a whole fell 65 percent. That paid for Yale and Harvard Business School.”
Howe has now been a fund manager for more than 30 years. He’s the founder and CEO of Geomatrix, a prominent investment fund in Asian markets. He also helps run the Akamai Finance Academy, a Kailua-based nonprofit that gives local kids the hands-on experience they need to compete with “Princeton trust-fund kids” for asset-management jobs on Wall Street. When Hawaii Business wanted to learn more about valuation, the complex art of analyzing what companies are worth, Howe seemed like the ideal teacher.
He had a better idea: Have some of Akamai’s young finance students analyze a few of Hawaii’s publicly traded companies. That way, we would learn which numbers analysts look at when they value important local companies, while introducing readers to Hawaii’s next generation of financiers.
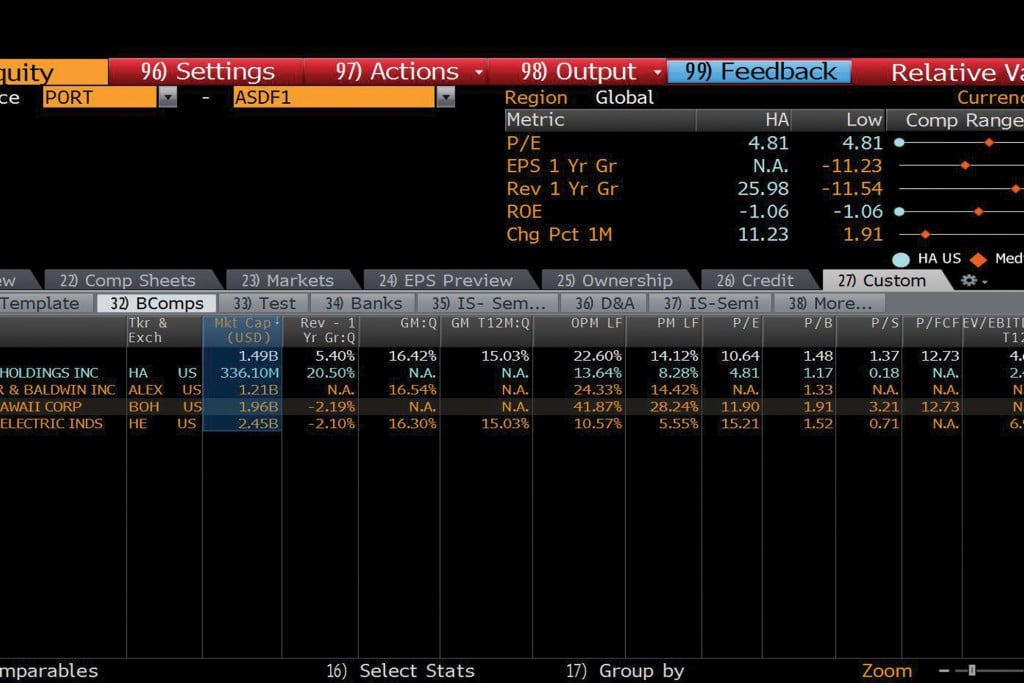
So, one Sunday morning, we sat down in front of the Bloomberg machines at the Akamai Finance Academy on the top floor of a nondescript two-story Kailua building to chat with three of the program’s star analysts: Segundo-Justin Sarce, a junior at UH-Manoa and a graduate of Kapolei High School; Jeffrey Sanchez, a freshman at Leeward Community College and graduate of Mililani High School; and Evan Minnick, a UH graduate and an associate with the program’s investment arm, Akamai Capital. Here’s their analysis of three Hawaii companies.
Hawaiian Electric Industries
The first problem facing an investor is how to get information. The Akamai analysts have access to high-test, six-screen Bloomberg machines, but they wanted to show that such costly resources aren’t necessary.
“When I started out,” says Sarce, “I didn’t know much about Hawaiian Electric or what types of businesses it was in, so the first thing I did was go to its website and search for the company’s annual report.” Googling “Hawaiian Electric investor information,” he quickly pulls up the company’s annual report and a long list of filings required by the U.S. Securities and Exchange Commission.
“Most publicly traded companies post their annual reports and other financial information online, always freely available to investors and analysts like ourselves,” Sarce says. Yahoo! Finance and similar free services also provide a lot of information. “Here, you can get an idea what a company does and how its financial results were for the fiscal year and compare those results to the previous year. You can also use the same data to compare HEI to other companies in the same industry.”
It helps to be fluent in Excel in order to make the most of the data. For example, Sanchez demonstrates how to copy tables from a 10-K, a company’s annual financial statement with the SEC, and paste them directly into an Excel worksheet so you can manipulate the data or create your own tables. Like any good analyst, he works quickly, without touching the mouse.
Which numbers are most important? That’s especially problematic for smaller, publicly traded companies – like most of those in Hawaii – that have limited coverage by analysts. The answer, Sarce says, is to look at how analysts cover other companies in the same industry.
“I would look at the largest company,” he says, “because larger companies typically have more analysts covering them. By reading their research reports, you can get an idea of what they look at, what kinds of multiples or ratios they use to chart this particular kind of company. For example, in the utility business, analysts often use the ratio of enterprise value to EBIDTA (EV/EBIDTA).” In fact, the “enterprise multiple” is a common way to determine the relative value of companies, particularly companies in the same industry. To understand why, some definitions are in order:
Enterprise value – the numerator in the equation – is what it would cost to completely buy a company in an arms-length transaction, Minnick says. EV is a more accurate value than the market capitalization often cited in the press because it accounts for a company’s debt. By definition, EV is the price to buy all the stock in the company – the market cap – plus pay off all the debt, minus cash on hand.
EBITDA – earnings before interest, taxes, depreciation and amortization – is a shorthand measure of a company’s operating profits. It basically adds interest expenses, taxes, depreciation and amortization back to net income to remove the sometimes arbitrary effects of financing and accounting decisions and focuses on the cash a business can generate. That makes it easier to compare companies with different capital structures or even companies in different countries with different tax systems.
The final equation – EV/EBITDA – gives investors a better sense of a company’s earnings compared to its size. A company with a low enterprise multiple might be undervalued because its earnings were relatively high compared to its size. But it’s important to remember, Sarce says, that the enterprise multiple varies among industries. High-growth industries, such as bio-tech or alternative energy, have higher enterprise multiples than mature industries, such as utilities.
Pulling up HEI on the Bloomberg display, Sarce points out that the utility’s enterprise multiple of 6.90 is well below the industry average of 7.93, which suggests the company is undervalued. But one thing you learn from talking to analysts is that no single number is enough. You need to understand how the multiples relate to one another and whether they’re trending up or down.
It’s also important for an investor to remember that no business or industry exists in a vacuum. The fortunes of a utility, for example, are often tied to fuel costs (though not at HEI, where the Public Utilities Commission has agreed to “decouple” the company’s earnings from sales and pass through any fuel costs to consumers). It makes sense to look at how those costs are trending.
“If it was coal,” Sarce explains, “you would want to look to see how the coal market’s doing. Was there something happening in the coal market that might affect the company in some way?” In other words, although all the standard multiples are backward looking, an investor also has to look forward.
You also have to consider your own investment strategy. For example, many people invest in utilities for the steady income from dividends. Not surprisingly, there’s a multiple for that, too: dividend yield – dividends per share divided by price per share – which produces an effective interest rate on your investment. Sarce points out that HEI’s dividend yield of 4.94 percent far exceeds the industry average of 3.77 percent. In fact, it’s among the highest dividend yields in the utility industry.
Does the combination of a high dividend yield and a low enterprise multiple make HEI a good value? Maybe. But the calculus is still more complicated. For example, HEI also has one of the lowest operating income margins in the industry, which might reflect the high cost of doing business in Hawaii or could mean the company operates inefficiently. Similarly, HEI’s net income grew by 22.87 percent in the last fiscal year, which looks pretty good compared to a 43.43 percent decline in net income across the industry. But Sarce points out that the growth in profits comes only after five years of decline, so it’s an increase from a low base. Then, there’s the old standby multiple: price to earnings ratio (P/E), which compares the price of a share of stock to the company’s earnings per share. On his Bloomberg screen, Sarce points out that HEI was trading at a fairly typical P/E of 15.21 (the industry average was 15.36). Does that mean the company is a typical utility? Hardly. HEI may be the only American utility that also owns a bank.
Minnick interjects with another dichotomy in the analysis of HEI: “A company’s value is usually driven either by the return on invested capital (ROIC) or growth,” he says. ROIC, he explains, differs from its cousin, return on equity, because it includes both equity and debt. “And they both matter,” he says; it’s simply a matter of how a company chooses to capitalize itself. But whether a company raises funds by selling shares or borrowing, it has to make profits off that capital, otherwise, no amount of growth will help. Yet, at HEI, the numbers are ambiguous again. Pointing out the company’s ROIC of 5.75 percent, Minnick says, “You can see HEI is kind of underperforming, at least compared to the industry average of 8.32 percent. That means its growth, an industry-leading 9.74 percent, is outperforming revenues. It’s still a positive factor, because it’s still growing and still profitable, but it could use its money more wisely.”
Does that mean you should invest in HEI? Maybe. “There’s a caveat to everything, pretty much,” Minnick says with a smile.
Bank of Hawaii
Multiples such as EV/EBITDA are important in evaluating utilities, but not banking.
“Banks I would consider more of a special case,” says Sanchez. “For example, a bank isn’t like a retail business. A retail business buys inventory and then sells it. A bank receives deposits, then it loans them out and collects interest. Ideally, it collects more interest on its loans than it pays out on deposits. So, for a bank, a ratio you would look at is the net interest margin (NIM). That pretty much measures the difference between the interest they pay out and the interest they receive. If you were comparing two banks – say, Bank of Hawaii and Citibank – you’d look at their net interest margins, and the company with the higher NIM would be assumed to be the better company.”
On the Bloomberg display, Sanchez shows that Bank of Hawaii’s NIM of 3.10 percent is substantially below the industry average of 3.57 percent. That may seem like a small difference, but these are percentages of the bank’s total invested assets. Even at Bank of Hawaii, which is one of the smallest publicly traded banks in the country, just increasing NIM to the industry average would mean nearly $59 million in additional net income. That’s real money.
On the plus side, some of the classic multiples, like return on equity (16.16 percent) and dividends yield (4.00 percent) seem to put Bank of Hawaii among the elite banks in the industry. In fact, with an ROE nearly twice the industry average of 8.40 percent, the company may be undervalued. Another figure lends this theory credence: In 2011, the company spent nearly $99 million buying back its own stock. Not only does this support the stock price; it suggests the bank thinks those shares are a bargain. But that’s not the end of the story.
“When you’re looking at banks,” Sanchez says, “or any investment, really, it’s not just profitability you have to consider, but risk. What are the chances that the investment could go against you and you could lose your money?” With banks, he notes, a lot of that risk is measured with a ratio called the allowance for loan and lease losses (ALL). That’s the bank’s estimate of the percentage of their outstanding loans and leases that could go bad. For Bank of Hawaii, ALL is just 2.50 percent, which is well below the national average, as it is for most of Hawaii’s conservative community banks. In other parts of the world, though, understating the ALL could drastically affect a bank’s valuation.
Minnick, for example, has a strong distrust of the way Chinese banks account for their ALL. “What Minnick says,” Sanchez explains, “is that Chinese banks look strong on their balance sheets – they have a lot of assets – but those are largely mortgage loans from the U.S. that are nonperforming.”
“They also have their own phantom cities,” Minnick chimes in. “In China, banks have small nonperforming loans to total loans ratios – extremely small for what you see in the news. They build 14-building mega-complexes and not a single person has moved in. These are real estate backed loans, which are the heart-blood of Chinese banks, so where is all the bad stuff showing up? It hasn’t yet; but it’s going to show up eventually. They hide it in those low provisions for loan loss accounts.” Although that particular issue probably isn’t germane to U.S. banks, it does highlight the complexity of bank valuations.
“Banks are kind of hard to evaluate,” Minnick says.
“Yeah,” Sanchez agrees. “In manufacturing or power generation, you pretty much know what all the inputs and outputs are, so it’s pretty much straightforward. But when it comes to banking, that’s one of the hardest industries to value.”
“You really can’t use earnings to value a bank. That’s because earnings and net income are all the way at the bottom of the income statement, which means you’ve already netted out interest and interest expense. But if you think about a bank, its primary revenue is interest. … The thing is, with banks, it’s very hard to separate the interest paid on loans to homeowners versus the interest paid to capital providers, etc.”
Because of this complication, he says, price to book (P/B) – also known as the price to equity ratio or P/E – is more meaningful for banks. But the P/B ratio, while useful, is still just a snapshot in time. As with all multiples, Minnick say, trends are probably more important than a single measurement. “As an investor, you have to look at historical levels. If the P/B is lower than it was three years ago, you’d want to look for a quantitative or qualitative reason why it’s trending that way. You’d also want to compare the bank’s P/B ratio with its peers.”
One of the advantages of investing in banks – at least in the U.S. – is that the information needed for valuation is collected systematically, both by regulating agencies like the Federal Financial Institutions Examination Council (FFIEC), and by the banks themselves in their SEC filings. For example, a bank’s 10-K filing with the SEC will contain a section on the company’s specific risks. An investor can use that information to evaluate the company’s prospective health and growth.
Glancing at the risk discussion in Bank of Hawaii’s 10-K, Sanchez notes, “What they mention right off the bat is that, ‘compared to other banks,’ their business is more tied to Hawaii and the Pacific Islands, which could have implications in the event of a crisis.”
“You can immediately extrapolate from that,” Minnick says. “Look at the next line: ‘The local economy relies upon tourism, real estate, government and other service-based industries.’ So, if you see how those industries are doing, that’s a direct driver of the bank’s profitability. If none of those industries is doing well, the bank isn’t going to be doing well either.”
Hawaiian Airlines
Although some multiples, like ROE or P/E ratios, are fairly standard across industries, many businesses develop unique metrics. In the airline industry, a standard unit of volume is “available seat miles” (ASM). This number crops up in most of the important industry multiples: Passenger revenue per available seat mile (PRASM); operating revenue per ASM; aircraft fuel expense per ASM, etc.
For a growing airline like Hawaiian and its parent company, Hawaiian Holdings Inc., this denominator is especially important. It’s not enough for an investor to know that more passengers have been carried, or even that revenues have grown – that’s to be expected as routes are added. But have those revenues been offset by increased costs? Has the company been able to maintain its efficiency as it grows? A glance at Hawaiian’s 2011 annual report shows that the airline’s PRASM has risen steadily – from 10.71 cents in 2009, to 12.32 cents in 2011 – even while fuel expenses and other costs have grown dramatically. Of course, capital expenditures – the cost of buying new airplanes – have also risen sharply: from $40.17 million in 2009 to $322.39 million in 2011.
But Sanchez notes it’s sometimes hard to know which multiples are most relevant for airlines. Should you focus on earnings, for example? “An airline’s earnings are heavily influenced by depreciation,” Sanchez says, “because they have a lot of planes and plant assets. It sounds a little shady to me, but they can choose how they depreciate the planes, depending on how much they want to earn that year.” That certainly affects how an investor weighs the importance of P/E ratios or earnings per share.
Minnick, though, is unperturbed by this apparent manipulation. “The word ‘manipulate’ has a bad connotation,” he says, “but there are reasons for these things in the airline industry.” A good example is the complications of spending lots of money to buy airplanes. “This way, you can accelerate your depreciation and control your earnings a little better: offset the early outflow of cash to buy the plane by charging a higher depreciation upfront.” Once again, the analyst has to weigh several factors when valuing a company.
Forty years ago, Robert Howe’s father taught him four basic multiples: revenue growth, price to earnings, return on equity and debt to equity. Looking at Hawaiian Air’s numbers, two of those multiples stand out: Revenue growth was a whopping 20.50 percent and return on equity (ROE) was a strong 27.95 percent. Growth and ROI. “So,” says Minnick, “holding everything else constant – no hidden surprises – you might be able to say Hawaiian Air is undervalued.”
In the caveat-ridden world of valuation, that sounds like an endorsement.