Hawaii Business BOSS – June 2013
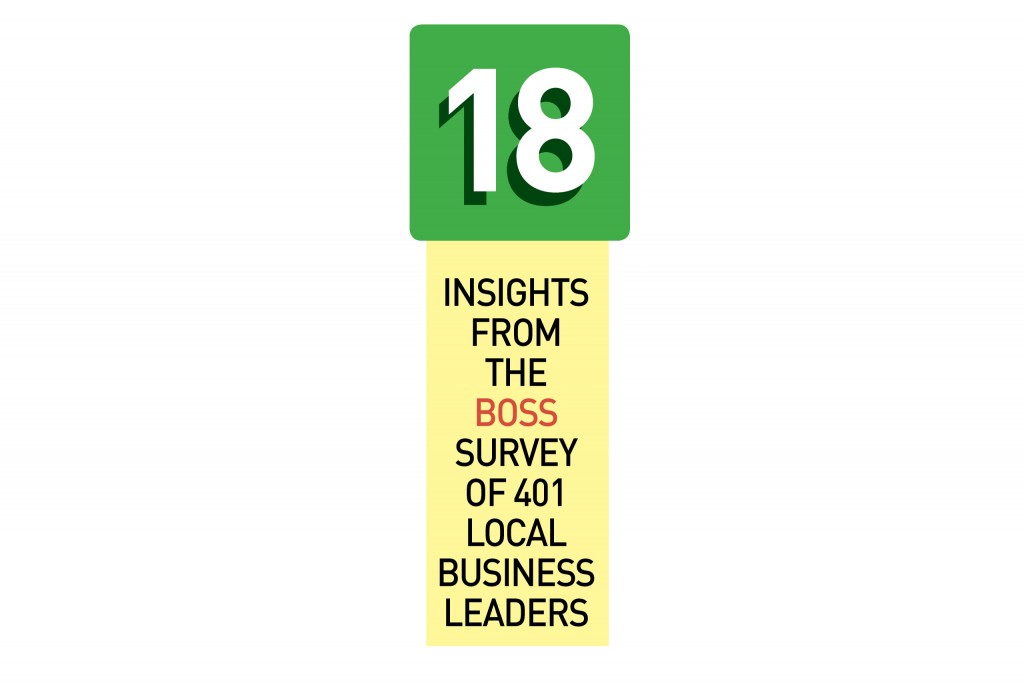
18 Insights from the BOSS survey of 401 local business leaders
Plus 10 nuances we thought you should know about
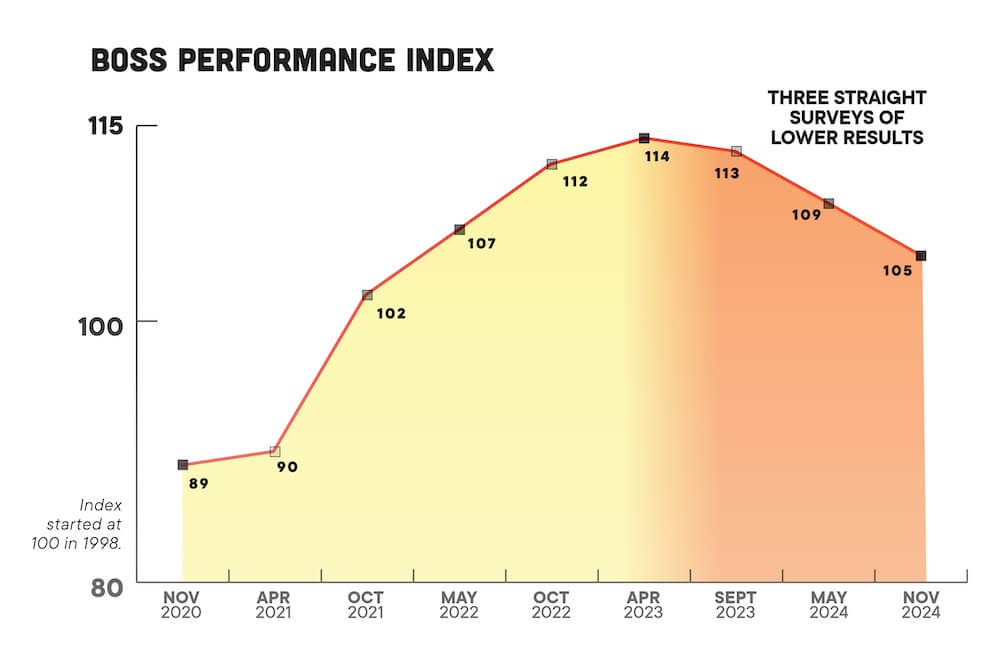
1. Performance Plateau
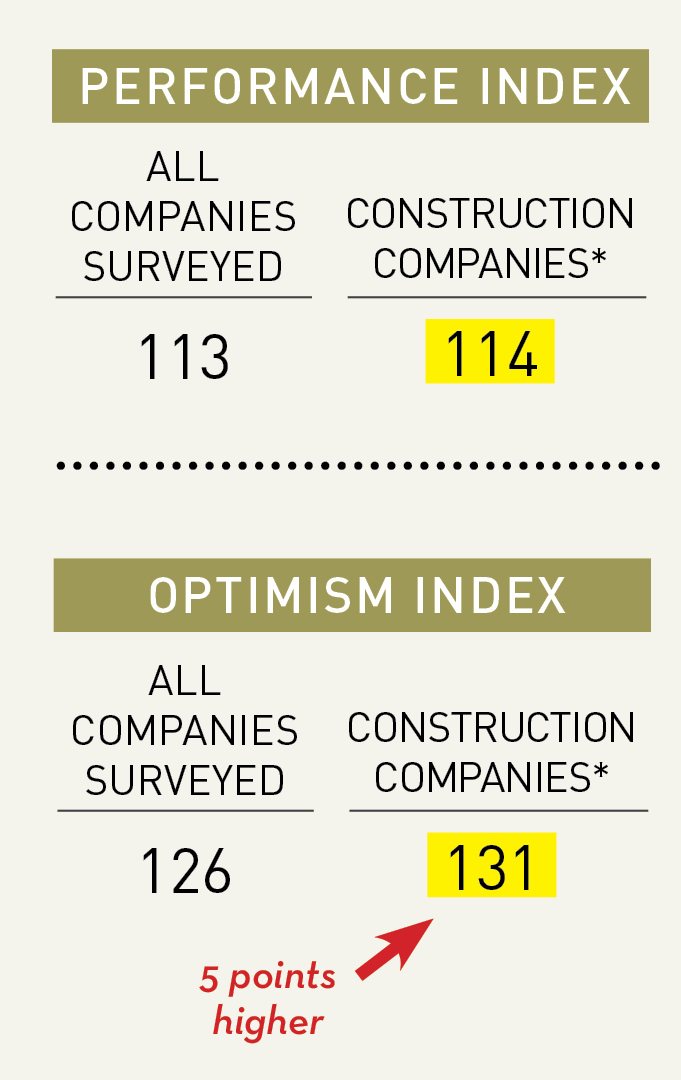
The Performance Index is at 113, virtually unchanged from October 2012.
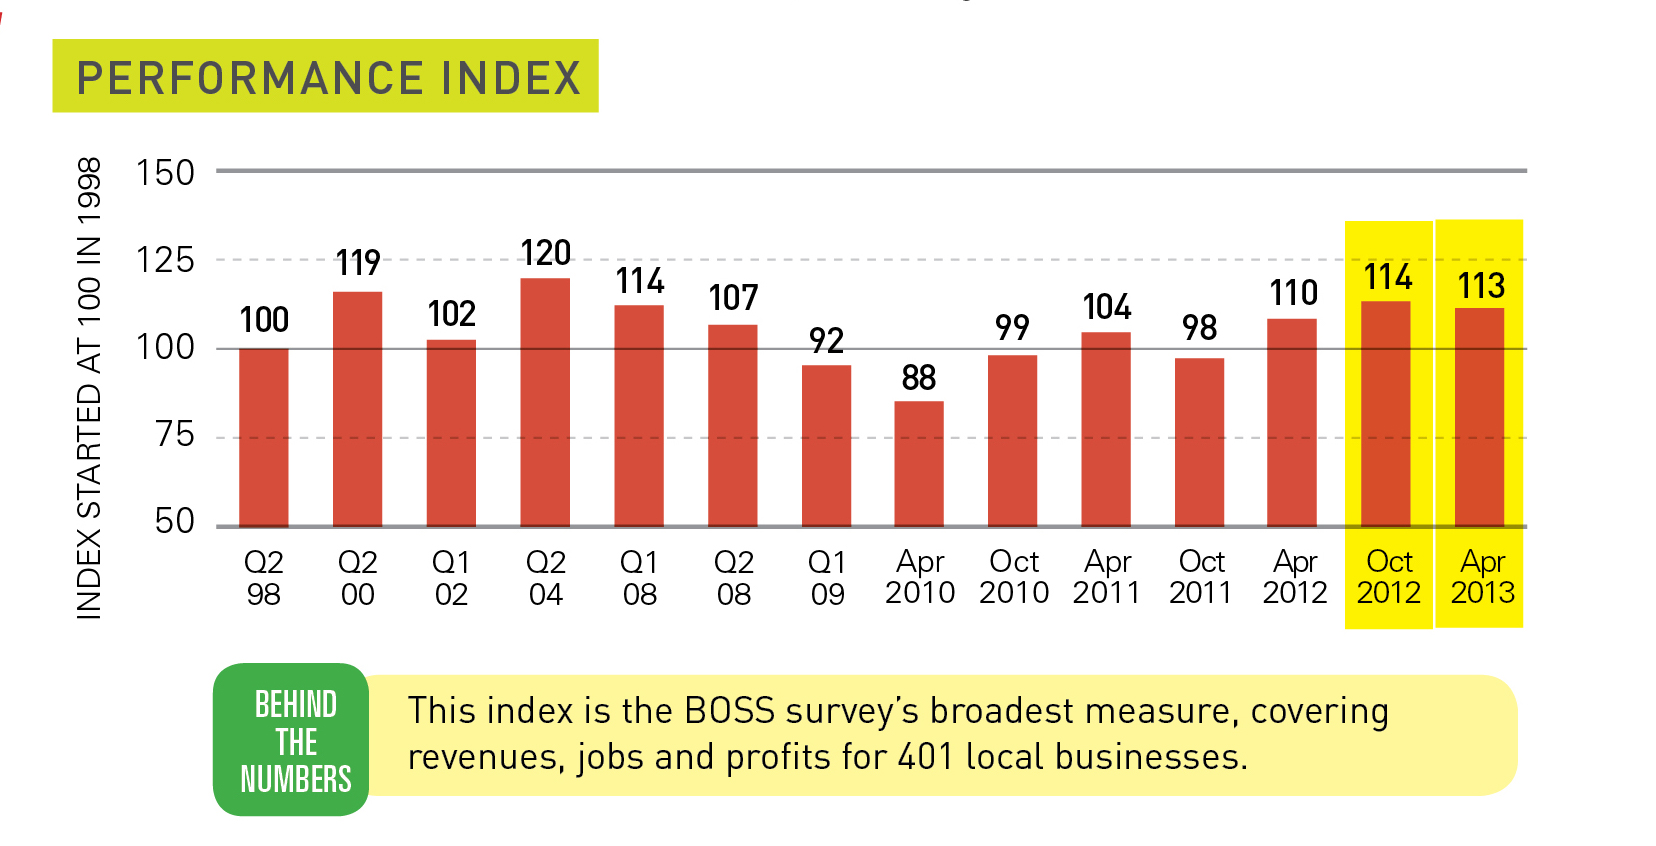
This index is the BOSS survey’s broadest measure, covering revenues, jobs and profits for 401 local businesses.
2. Future Still Looks Bright
The Optimism Index measures business leaders’ confidence in the overall Hawaii economy over the coming year. It is at 126, down slightly from October 2012. Don’t overreact to the slight dip in the optimism of those polled: The latest result is tied for third-best ever in the 15 years of this survey.
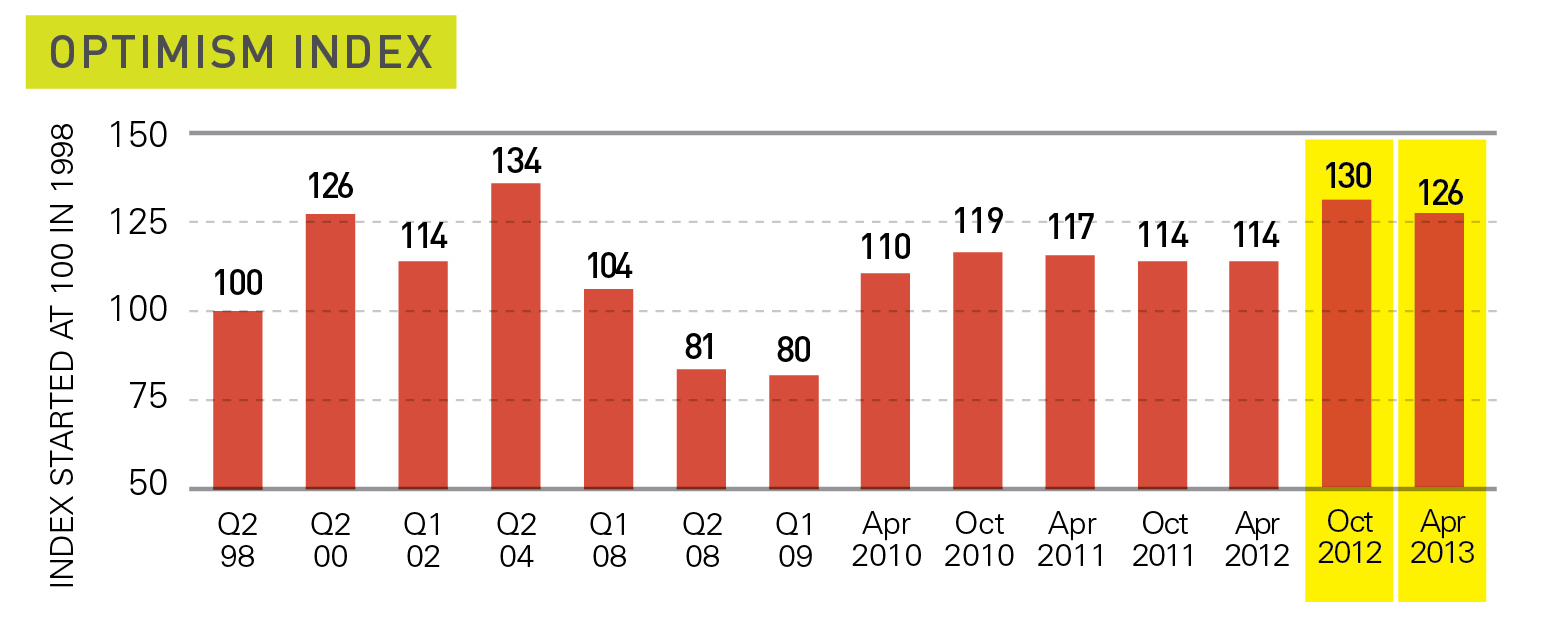
But more pessimists now: The number of leaders who said the overall Hawaii economy would get worse in the coming year rose from just 13 percent last October to 19 percent in this survey.
3. Hiring More? Not Really
After relatively steady gains since 2009, the Employment Index showed a small but significant decline in 2013. That index is based on whether the 401 business leaders surveyed said they increased or cut their workforces over the past year, or held steady.
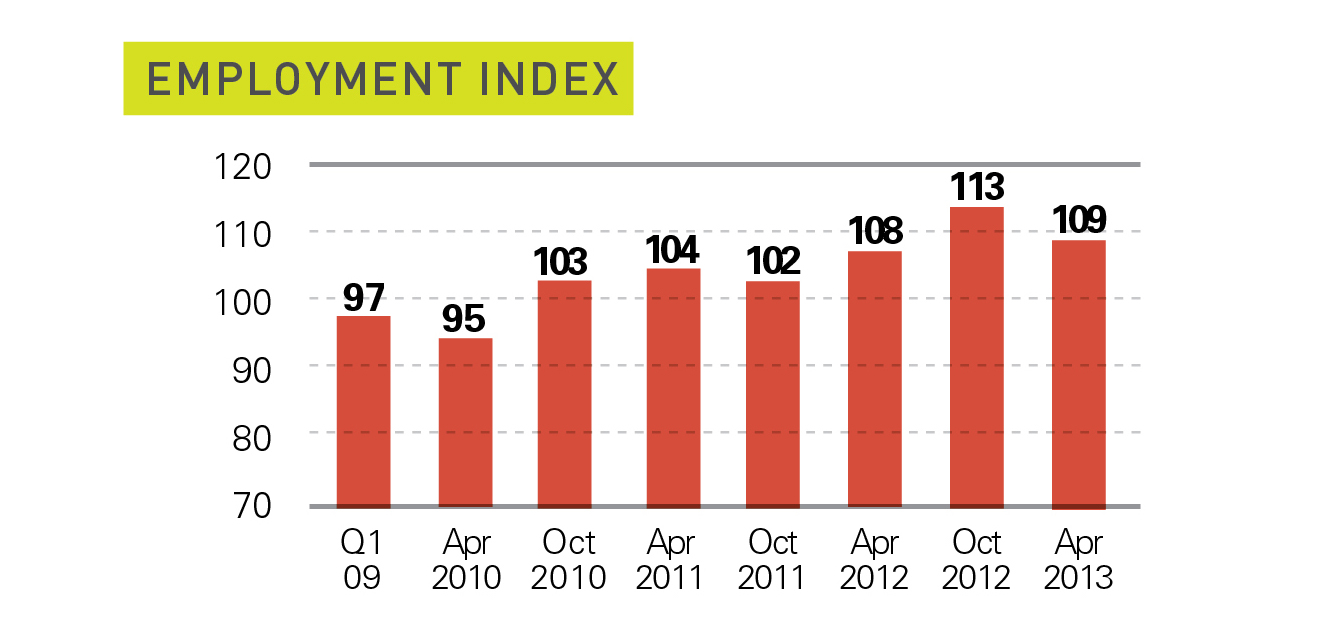
Important Detail The proportion of businesses reporting increased staff has fallen from 26 percent in October 2012 to 18 percent in this survey.
4. No Change on Revenue and Profit
Our Revenue and Profit indexes show very similar results over the past two surveys.
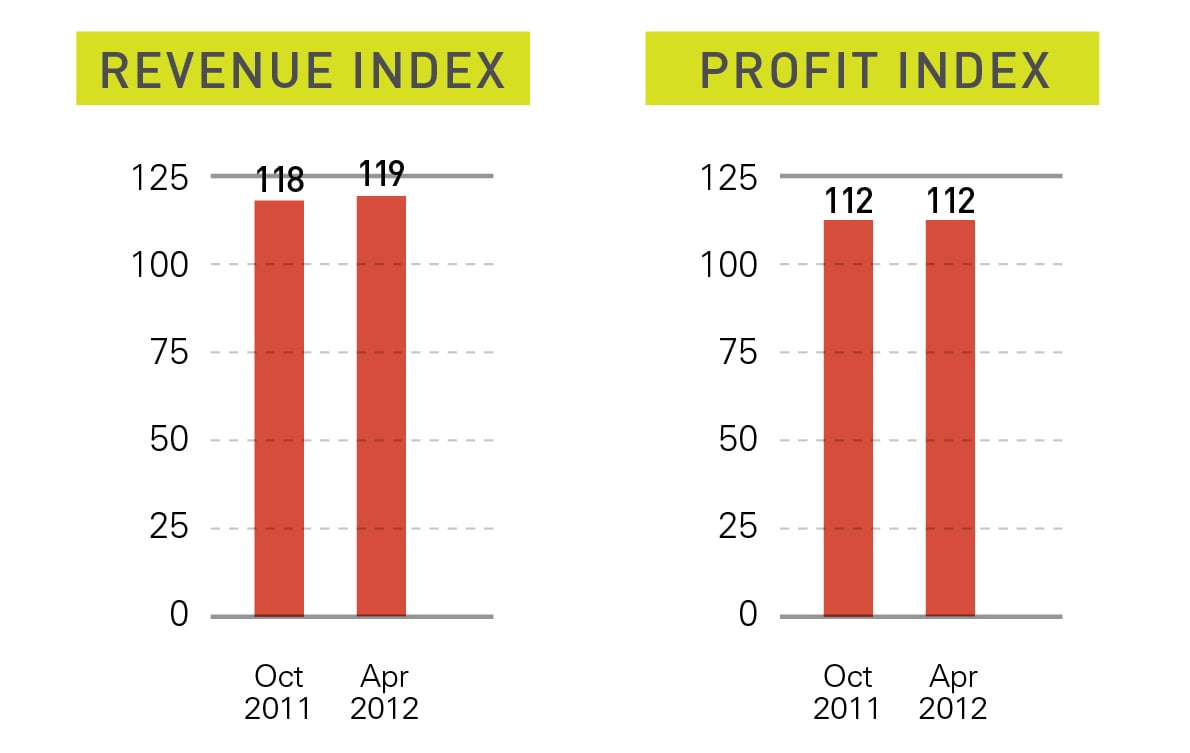
Volatile Fine Print The number of companies whose profits held steady from the previous year dipped to 18 percent – the lowest percentage since 2010. Overall, 38 percent said profits rose and 34 percent said profits fell. That’s a lot of volatility, though it’s evenly balanced.
Construction Outlook
In this section of the BOSS survey, we focus on the responses of 101 leaders in the local construction industry.
5. More Optimism
You can see where the construction industry thinks it’s headed: Construction’s Performance Index is virtually identical to that of the overall economy’s Performance Index, but construction’s optimism about the coming year is much stronger.
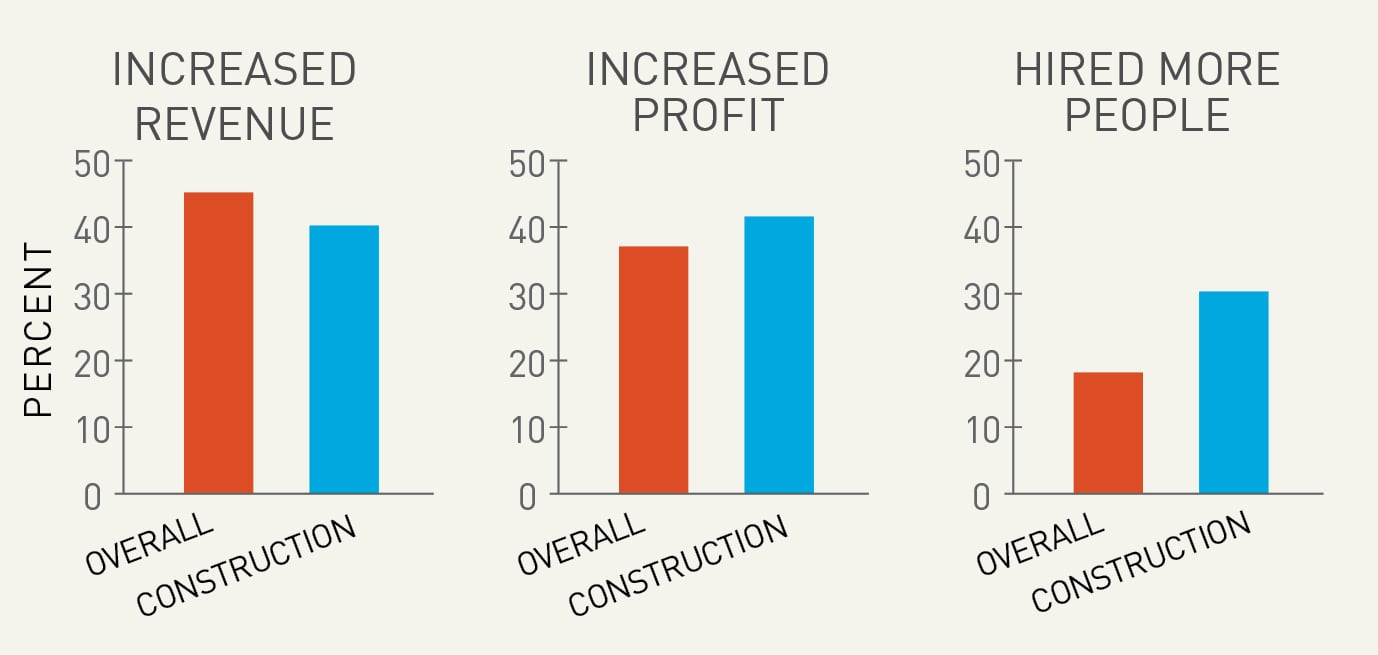
6. Where New Jobs Are
The BOSS survey’s Performance Index is based on companies’ revenues, staffing and profits over the past year. On revenues, construction companies did a little worse than the average Hawaii company; on profit, they did a little better. But construction companies did a lot more hiring in the past year than the average Hawaii companies.
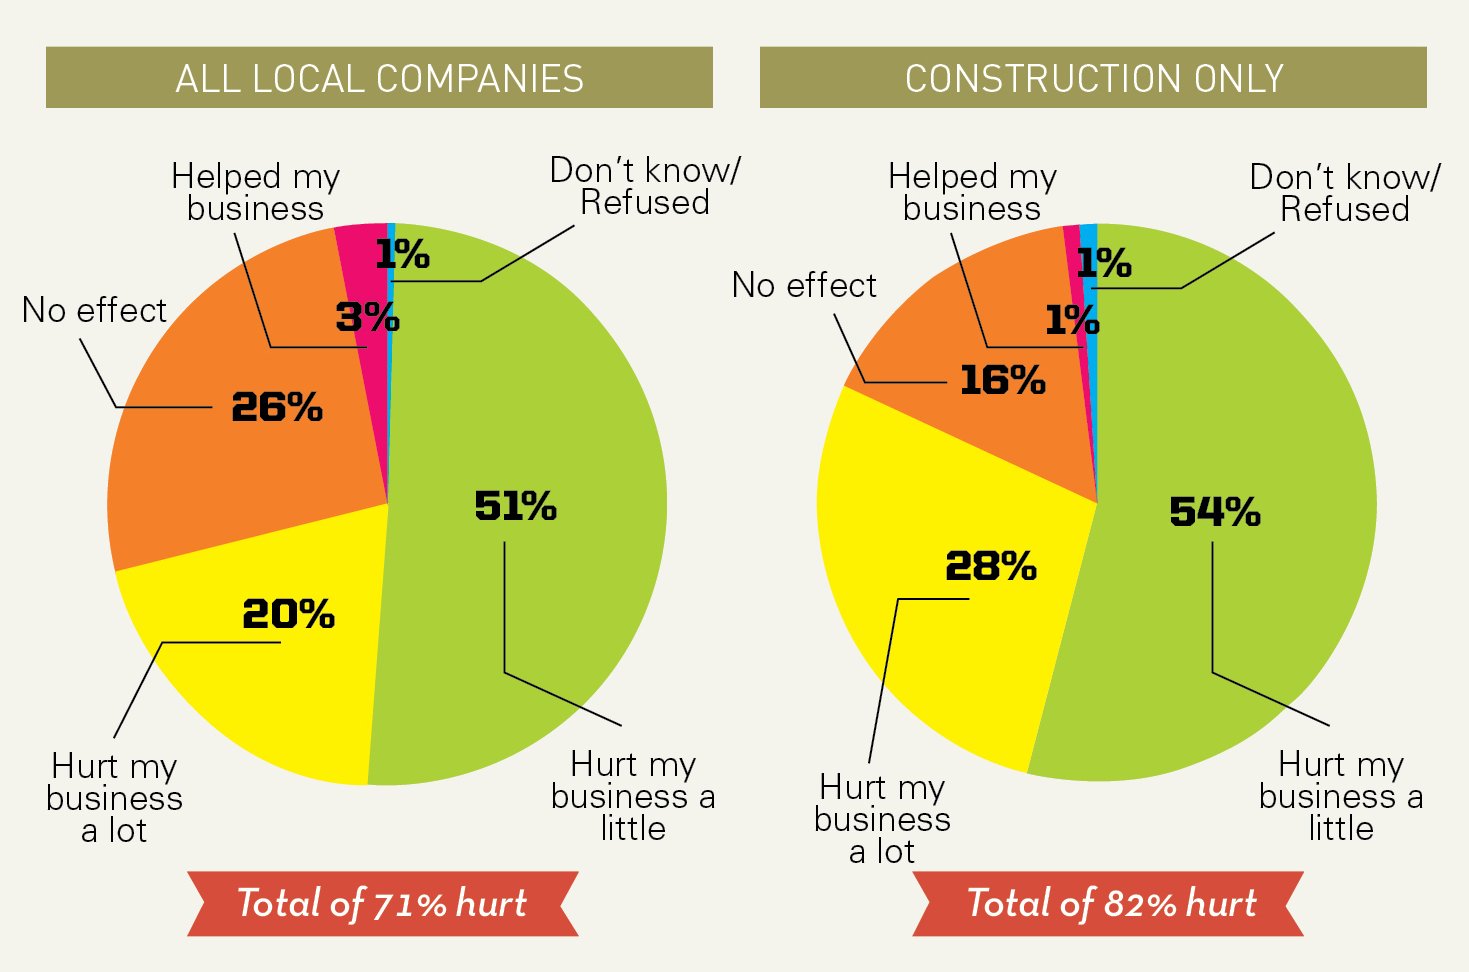
7. Oil Price Victims
When the price of gas goes up, construction companies are among the hardest hit. Here’s what we learned when we asked: Was your company helped or hurt by high gas prices?
8. Good Times, Bad Times
No question that the construction industry is doing better than it did two years ago, but not as well as during the boom times in 2007.

Do The Math More than half of the companies surveyed – 55 percent – say they enjoyed greater revenue over the past year. In 2011, only a total of 38 percent said the same thing. The total in 2007: An astounding 75 percent reported increased revenue. Will Hawaii’s construction industry ever see such boom times again?
9. Where Did You Earn Your Money?
Construction and related companies were asked to estimate the proportion of sales over the last year derived from the private and public sectors. After a big increase in private-sector contracts during the middle of the previous decade, the past two surveys have shown a roughly 2-to-1 ratio between private- and public-sector revenue.

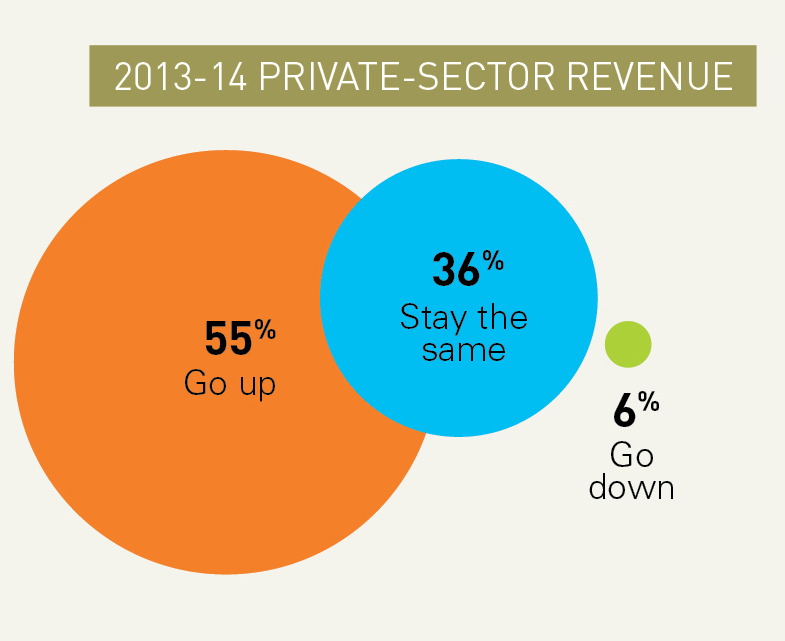
10. Where’s Your Next Meal Coming From?
We also asked construction industry leaders: Will your private-sector revenue rise, fall or hold steady in the coming year or two; 55 percent say it will go up.
History Lesson: 55 percent is the highest percentage of respondents since we first began asking the question in 2001.
11. Not As Optimistic About Government Work
The construction companies were asked the same question about their expected revenue from government projects. The answers were far less optimistic.
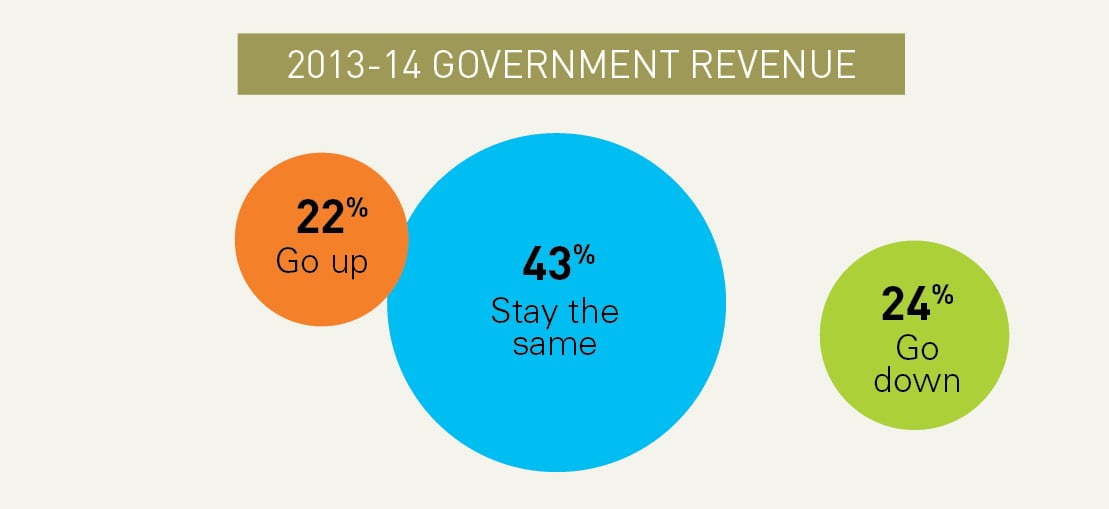
Opposite History Lesson: You might have guessed: Fewer companies than ever said their revenue from government contracts would go up in the next year or two. If Charles Dickens wrote about the short-term future of Hawaii’s construction industry, he might have called the book, “A Tale of Two Sectors.” Or maybe, “Great (and Not So Great) Expectations.”
12. Staying Home
We asked construction companies where their work was being done. The proportion of Neighbor Island work has held steady through the ups and downs of recent years. However, the few but substantial contracts that local companies were fulfilling outside of Hawaii in 2007 have generally not come back.
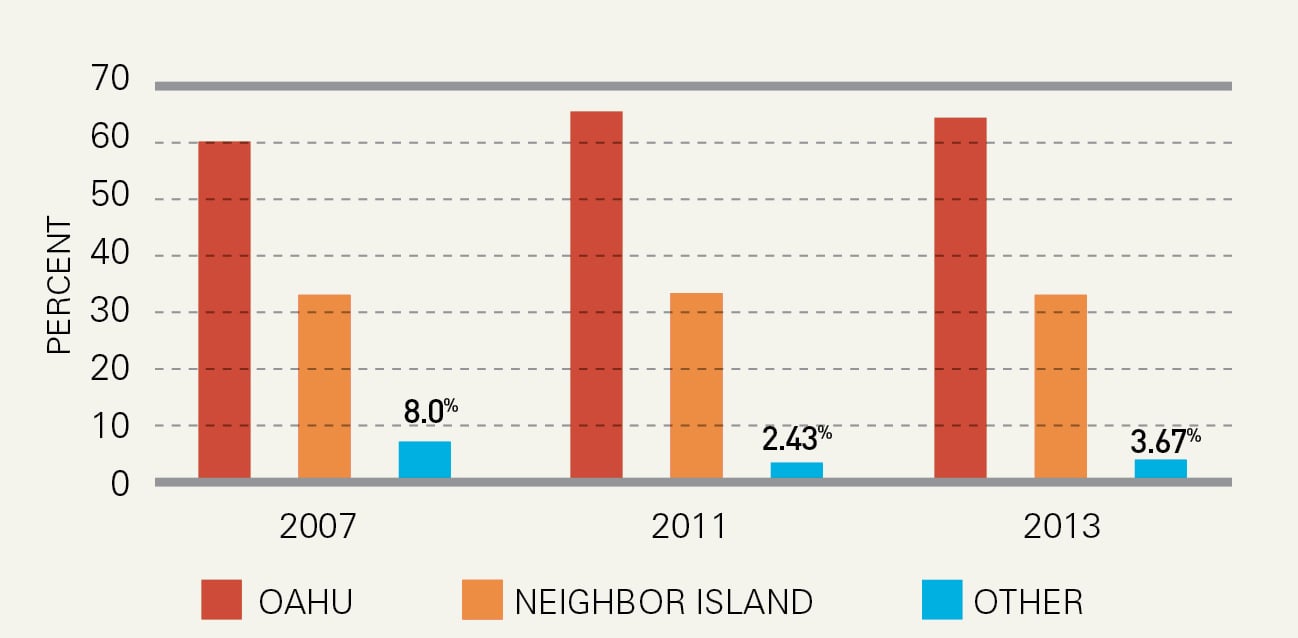
Fine Print: Of course, these figures are directly affected by the sample; 70 percent of the firms taking part in this section are based on Oahu, but that reflects the statewide distribution of Hawaii’s construction industry.
13. Backlogs Bad, Backlogs Good
No one wants to fall behind in their work, but project backlogs in the construction industry are much better than idle men and machinery. Did the number of your backlogs increase, decrease or hold steady in the past year or two? Our survey found the increase in backlogs is the highest since 2005.

Big vs. Small: Just 26 percent of construction firms with fewer than 10 employees report more project backlogs. But among firms with 100 or more employees, 50 percent report more backlogs.
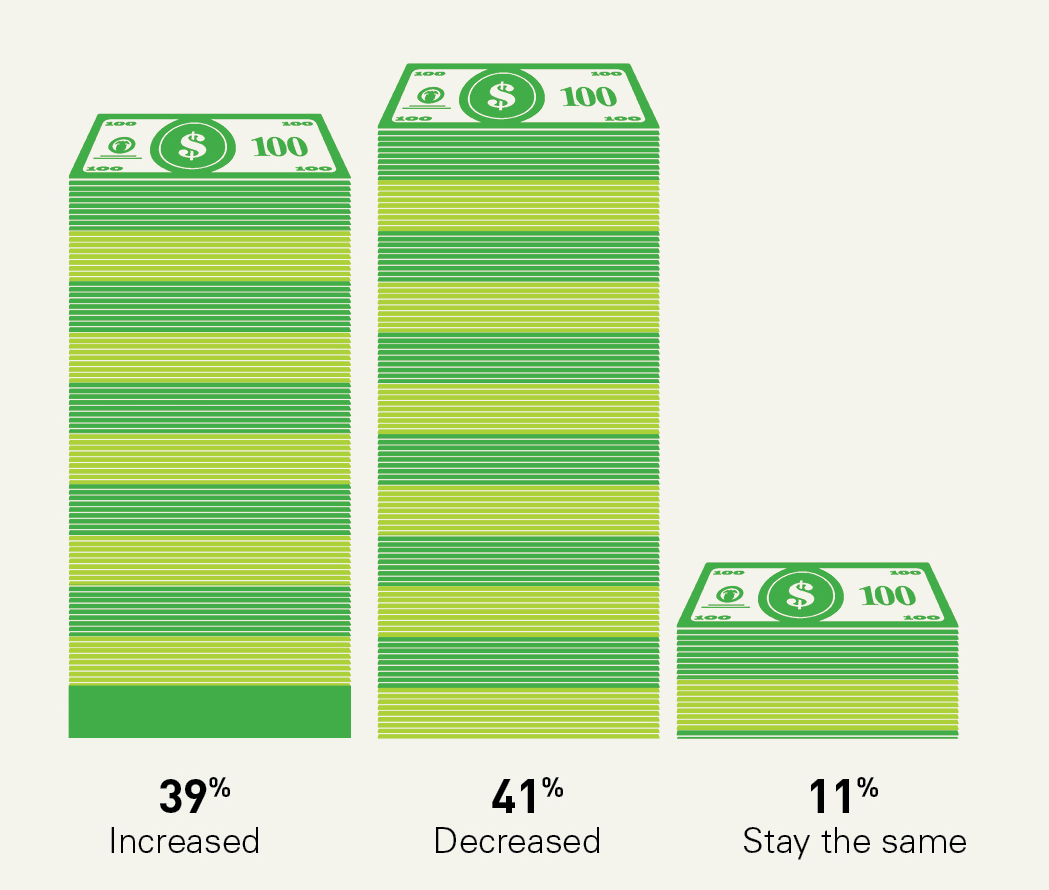
14. Profit? What Profit?
On average, did your profit per project go up, down or stay the same in the past year? By a small margin, more construction companies say their profit per project was down than up. Of course, it could have been worse: In the 2011 survey, 53 percent said their profit per project was down.
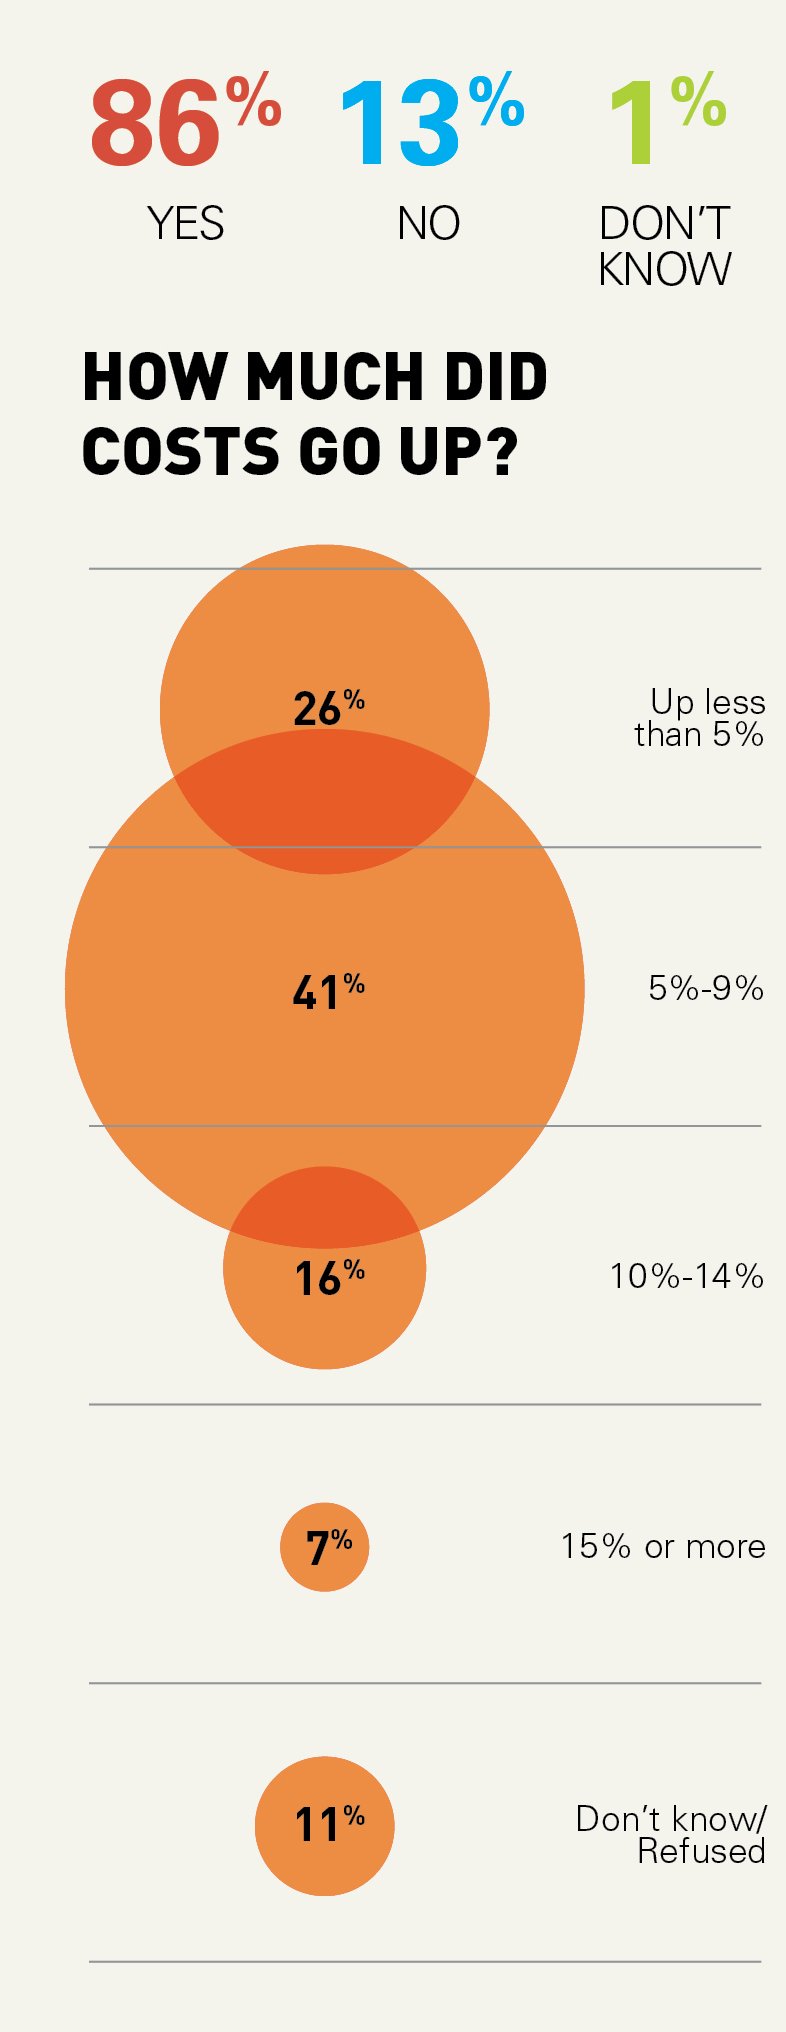
15. Rising Costs
Have your costs risen over the past two years?
Important Detail The latest survey indicates that the rise in construction costs has slowed down compared with the 2011 and 2007 surveys.
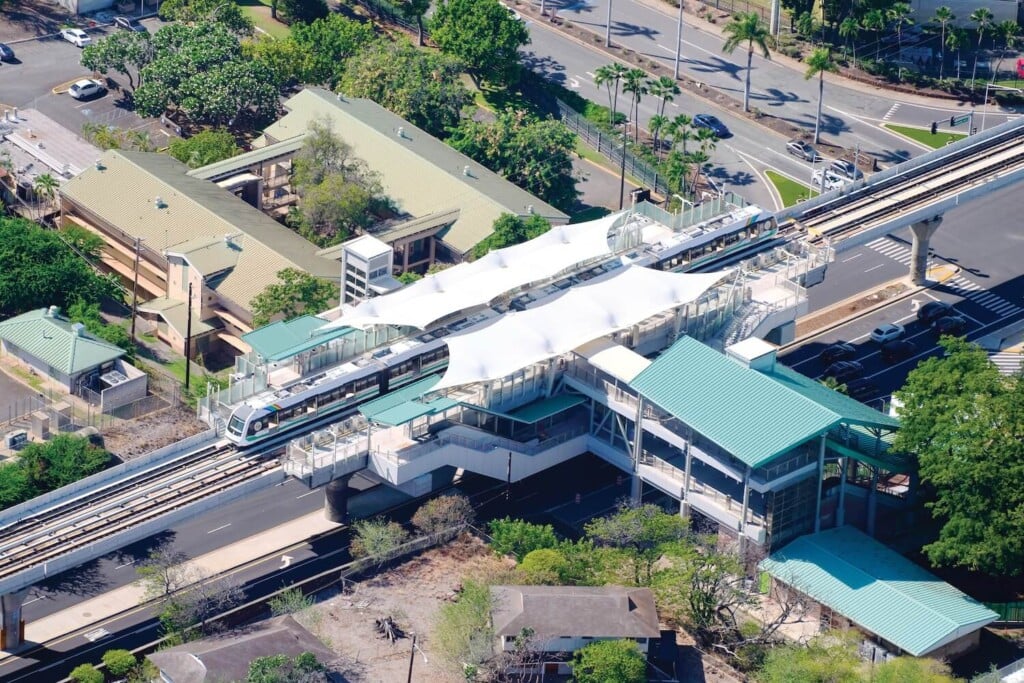
16. Rail’s Not For Everyone
Almost three-quarters of the construction companies surveyed do not expect to do any substantial work on the Honolulu rail project. The number of companies actually working on rail or about to work on rail has risen. However, the number who have not gotten a rail contract yet, but are still holding out hope, has fallen from 24 percent to 12 percent.
| 16% | Yes I already have lined up work for this year or next on the rail system |
| 12% | No, But we will bid and I hope to get a substantial amount of rail work eventually |
| 72% | No I don’t think I will get any substantial rail work |
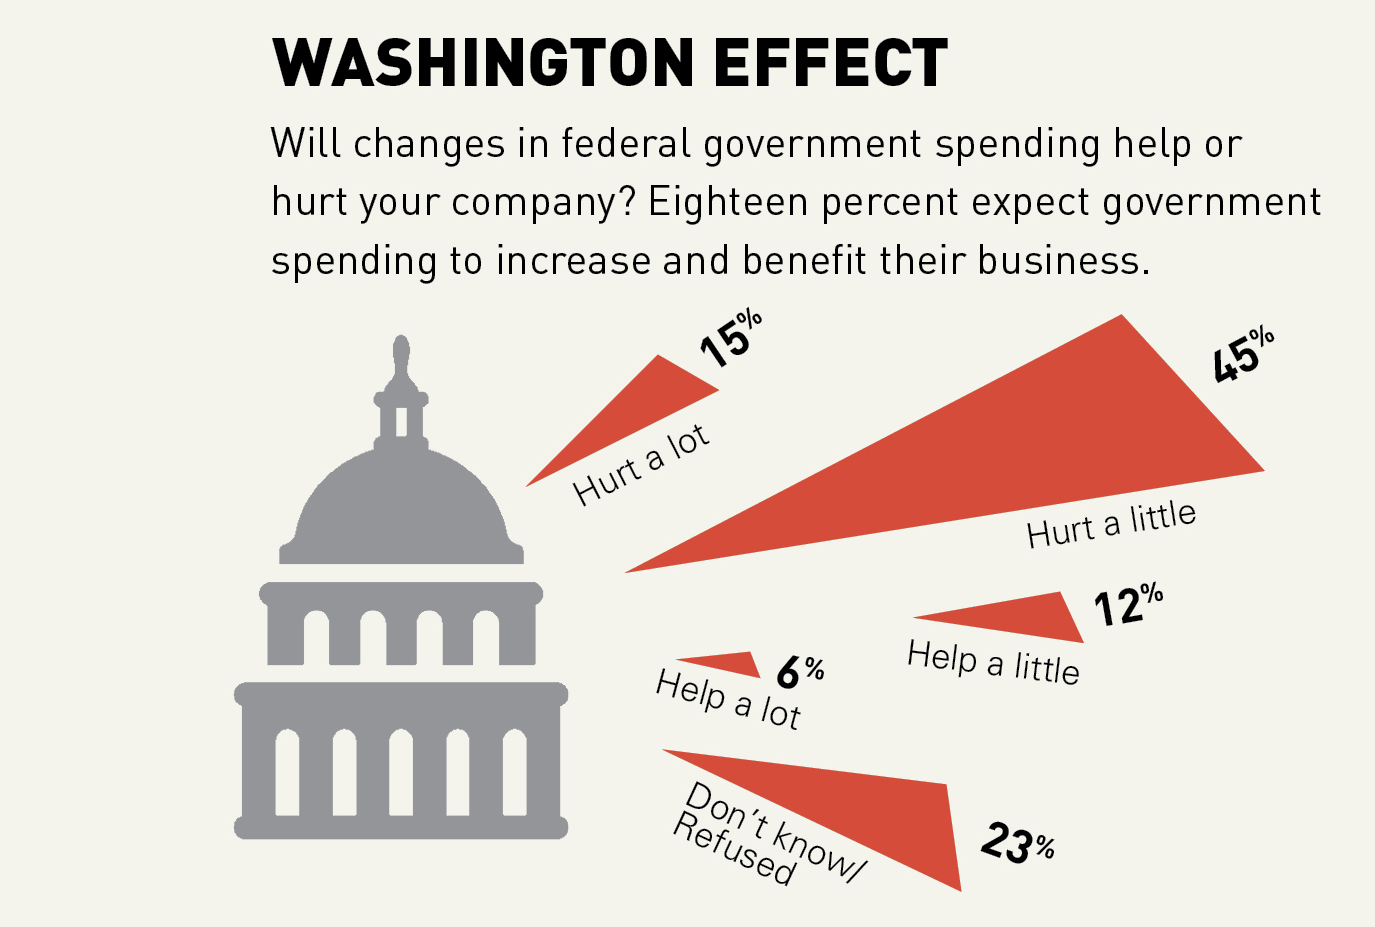
Washington Effect
Will changes in federal government spending help or hurt your company? Eighteen percent expect government spending to increase and benefit their business.
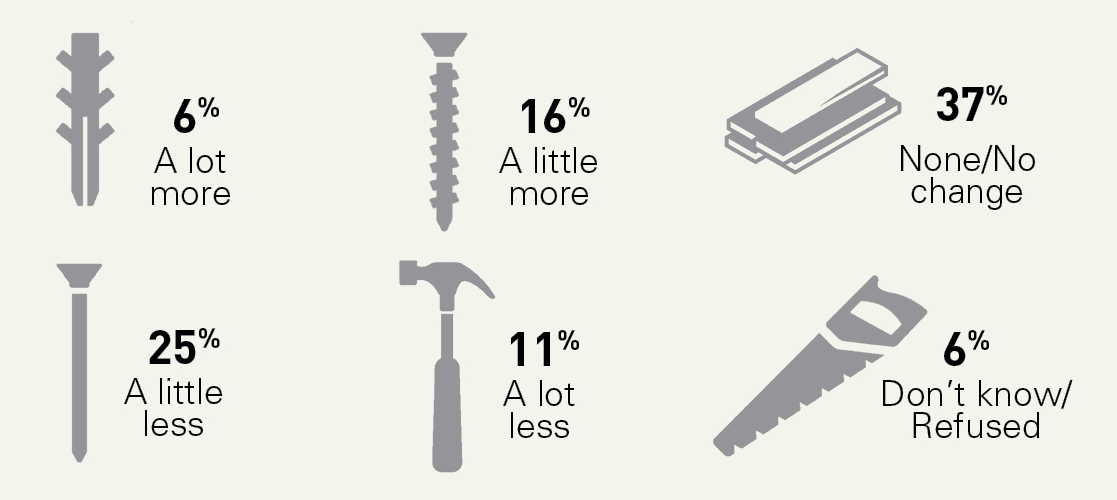
17. Prefab Materials
Are you using more or less prefabricated materials?
18. Predicting Construction’s Future
Construction firms were asked about different economic sectors in the local construction industry and how each would fare over the next two years.

What’s the BOSS?
BOSS stands for Business Outlook and Sentiment Survey.
Our polling partner: QMark Research, www.qmarkresearch.com.
When: This edition of the twice-a-year survey was based on 401 random interviews of business executives and owners conducted by QMark from March 25 to April 4.
Who: The sample includes proportionate representation of all sizes of Hawaii companies: Businesses with three to nine employees are designated as “very small;” 10 to 49 employees as “small”; 50 to 99 employees as “medium”; and 100 or more employees as “large.” The data was weighted to reflect the proper proportions of each company segment based on number of employees as reported by the state Department of Labor.
Construction: The construction section of the survey was based on a subset of the overall survey: 101 business leaders who describe their companies as doing a majority of their work in the construction industry.
Where: Executives on all the major islands were interviewed, in proportion to the relative size of their island’s business activity.
Margin of error: A sample of this size (n=401) has a margin of error of +/- 4.90 percentage points with a 95 percent level of confidence.
Indexes: All indexes began at 100 when this series of surveys was launched in 1998.
Rounding: Some charts may add to more than 100 percent or less due to rounding.