Finding the Signal Amid All the Noise
Even more than most scientists studying climate change, Camilo Mora has an apocalyptic vision of the future. In a controversial paper published this year in the journal Nature, Mora, a biogeography researcher at UH, tries to calculate the date of what he calls “climate departure” – a term for the point at which our climate changes irrevocably from something we’ve known to something we’ve never seen before. According to Mora, that date is coming sooner than you think.
Climate, of course, is different than weather. To highlight that difference, scientists often resort to the analogy of a man walking his dog. As the man strolls more or less directly from Point A to Point B, the dog zigzags randomly on his leash, sniffing at the flowers on the left, inspecting the hydrant on its right, etc. If you chart the dog’s course, the graph of its movement seems like an erratic, unpredictable line. The dog is the weather. On the other hand, if you chart the course of the man, you see steady progress from A to B. This is the climate trend that underlies the weather.
To avoid the variability inherent in weather, scientists generally take the long view when they talk about climate – usually 35 years or more. For Mora’s purposes, climate is bound by the recorded temperatures between 1860 and 2005. In his scenario, the point of climate departure for any place on Earth will occur in the year when even the coldest subsequent year, as measured by its mean annual temperature, is warmer than any year prior to 2005. Using sophisticated computer models and historical data from 21 climate centers in 12 countries, Mora estimates this date for thousands of points around the world, including Hawaii.
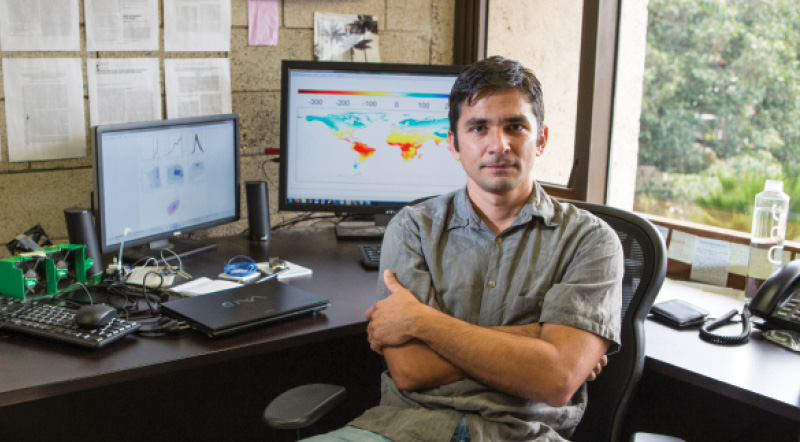
Photo: David Croxford
“So, how much time do we have left before the year of climate departure?” he asks. “In Hawaii, the year of climate departure is 2029. I’m 39 now; that means I’ll only be 54 years old.”
Mora notes that climate departure will come sooner for tropical islands, like Hawaii, because of the relatively narrow range of temperature extremes – no great variation between winter lows and summer highs. The climate models also depend on how the world deals with external “forcings” – things like CO2 emissions that affect future climates. But, by Mora’s calculations, all scenarios are grim.
“Globally,” he says, “even if we take action now on reducing the emission of greenhouse gases, the average date of climate departure is still only 2069. If we don’t take action, it’s going to be 2047. My point is that we’re going to live to see this happen. Climate departure isn’t a legacy we’re going to leave our children and grandchildren; it’s a legacy we’re leaving for ourselves. And it’s happening right now.”
Mora’s apocalyptic vision also extends to the effects of climate change. For example, he foresees an epoch of massive extinctions, especially in tropical places like Hawaii, where endemic species evolved in a narrow environmental range and consequently have little genetic diversity. Similarly, he says, future climate scenarios mean Hawaii should expect warmer temperatures, dramatically less rainfall and diminished groundwater. Perhaps most troubling, if Mora’s simulations are correct, our estimates of sea-level rise may be much too low.
Mora’s calculation of climate departure is controversial among climate scientists. In particular, they criticize his statistical methods, which, they say, may greatly overstate the speed of climate departure. For example, Mora only ran his models to the year 2100; when the simulations are run longer, they produce some extremely cold years as much as 100 years in the future, postponing the point of departure considerably in some locations.
But, in a sense, this is quibbling over details. Most of Mora’s broader conclusions are uncontroversial among scientists. And, while the exact date of climate departure may be later than Mora predicts – both globally and for Hawaii – most climate scientists believe the effects of climate change are already upon us. We only need to know where to look.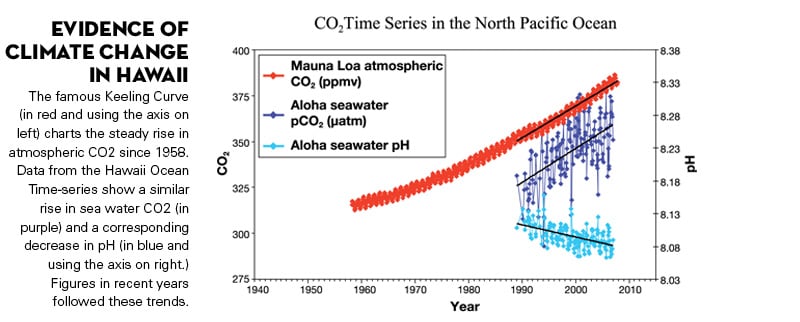
400 parts per million CO2
Let’s start with the easy stuff.
Probably the most famous of data sets of climate science – not just for Hawaii, but for the world – is a long-term time-series known as the Keeling Curve.
In 1958, Charles “Dave” Keeling of the Scripps Institute for Oceanography established an atmospheric observatory 11,135 feet up the north slope of Mauna Loa. Every hour for the past 56 years, the Mauna Loa Observatory has measured the amount of carbon dioxide – CO2 – in the atmosphere. Charting these concentration levels over time, Keeling discovered that they fluctuate, both by time of day and by season, but, on average, they’ve been steadily increasing, year after year. In some ways, this discovery opened the discussion of climate change.
CO2, of course, is one of the principal greenhouse gasses that contribute to global warming. Increasing CO2 levels are also considered some of the best evidence that human activities are contributing to climate change. CO2, after all, is a product of combustion and has been rising steadily since the beginning of the Industrial Era. Using data from ice cores, scientists estimate that, in 1700, the mean concentration of CO2 in the atmosphere was a little less than 280 parts per million. By 1958, when Keeling took his first measurements at the Mauna Loa Observatory, the atmospheric concentration of CO2 was already 313 ppm. In May 2013, the fluctuating levels of CO2 on Mauna Loa exceeded 400 ppm for the first time, a level not seen on the planet in perhaps 15 million years. Even if the world were to dramatically reduce current emissions, scientists don’t expect CO2 concentrations to return to pre-Industrial Era levels for tens of thousands of years. In other words, climate change in Hawaii (as in the rest of the world) is irrevocable.
pH = 8.06
The Keeling Curve isn’t the only long-term time-series of climate data from Hawaii. Since 1988, UH scientists have been making nearly monthly voyages to a six-mile-wide circle in the ocean called Station ALOHA – short for “A Long-term Oligotrophic Habitat Assessment.” This deep-water site, about 60 miles north of Oahu, has seen a variety of related oceanographic research, including the famous Hawaii Ocean Time-series – HOT, for short.
One example: sea surface temperatures at Station ALOHA have been increasing at roughly a third of a degree Fahrenheit per decade. This roughly mirrors the atmospheric change as measured at the Mauna Loa Observatory. This may not seem like much, but it means that sea surface temperatures at the end of the century will be approximately 3 degrees warmer than they are now, potentially accelerating the melting of sea ice in the Antarctic and the rise in sea level.
Included in the HOT data is a sort of analog to the Keeling Curve. Climate scientists have long known that much of the excess CO2 (and as much as 90 percent of the excess heat) in the atmosphere is absorbed by the ocean. Indeed, 16 years of HOT data show that CO2 levels in the surface water at Station ALOHA have been rising at almost exactly the same rate as those in the atmosphere at the Mauna Loa Observatory. The effects of this increase may be dire for marine life.
That’s because some of the CO2 in seawater naturally converts to carbonic acid, gradually increasing the acidity of the ocean. At Station ALOHA, this is indicated by the surface water’s declining pH, which has fallen from a mean of about 8.12 in 1988 to 8.06 in 2014. This decline mirrors the global trend that has seen ocean acidification increase nearly 30 percent from pre-industrial levels.
The problem is that ocean acidification affects marine life, particularly the ability of corals and shellfish, especially juveniles, to secrete the calcareous material they use to build their shells or exoskeletons. As an indirect result of this, some of the large oyster farms from California and Oregon have established hatcheries in Hawaii because higher acidification in West Coast waters have interfered with the shell formation of oyster larvae. The prospects for coral are even more alarming. Some scientists believe that most of the world’s corals simply cannot survive the levels of CO2 being pumped into the atmosphere. A paper this year in the journal Science says that, by mid-century, 98 percent of today’s coral reefs will be in water too acidic for corals to grow.
Bleaching Coral
Hawaii’s corals are already suffering. Increased acidification has begun to reduce the ability of coral polyps to lay down the calcareous skeleton that becomes a reef. Even more critical, warmer water has provoked the worst coral bleaching incident in Hawaii’s history.
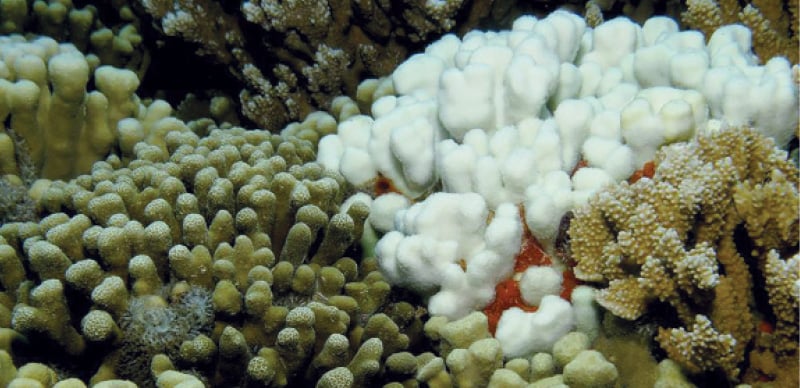
Healthy and bleached coral in Kaneohe Bay. Photo: Courtesy Ruth Gates
Ruth Gates, a prominent researcher at UH’s Hawaii Institute of Marine Biology, points out that healthy coral is usually brown. A single head of coral is actually a super-colony composed of hundreds or even thousands of individual coral polyps. Each of those polyps contains within it a vast community of symbiotic organisms, unicellular microalgae called zooxanthellae. Like all plants, these algae use photosynthesis to convert the sun’s energy into carbohydrates. Because they live right in the tissues of the polyp, they feed the coral from the inside and give healthy coral its brownish color. But, when corals are stressed – for example, when faced with warmer than normal water – the polyps begin to expel their symbionts. That’s what we call “bleaching.” If the bleaching lasts long enough, the coral dies.
Unfortunately, this year Hawaii is experiencing some of the warmest sustained water temperatures ever recorded here.
“This is a bad scene,” Gates says. “What’s happened this year exemplifies, I think, what’s happening with climate change in general. We’re seeing excursions outside the normal temperature range. Our weather pattern, this year, has been really unusual. We haven’t had many trade winds. And, in places like Kaneohe Bay, there’s not a lot of circulation. So, we’ve had this embayed water; there have been very high UV intensities; and there have been very high temperatures. The water temperature has exceeded its normal annual range, and it has exceeded it for a period of time that’s outside of the ability of the coral to regulate its biology and maintain its symbiotic population. So, it’s bleached. And we’re in the middle of a massive bleaching event here in Hawaii that’s effecting between 50 percent and 75 percent of the corals in Kaneohe Bay.”
All of these, of course, are the effects you would expect from climate change. But we can’t say for sure that they are climate change. The data are clouded by random weather events and long-term but poorly understood climate patterns, such as the El Nino-Southern Oscillation (ENSO) and the Pacific Decadal Oscillation (PDO). This is the problem climate scientists call the signal-to-noise ratio: It can be difficult to distinguish long-term trends (the signal) from natural variability (the noise). Few scientists – and certainly not Gates – doubt that climate change plays a part in the worldwide decline in coral health. But local events can also be driven by randomness.
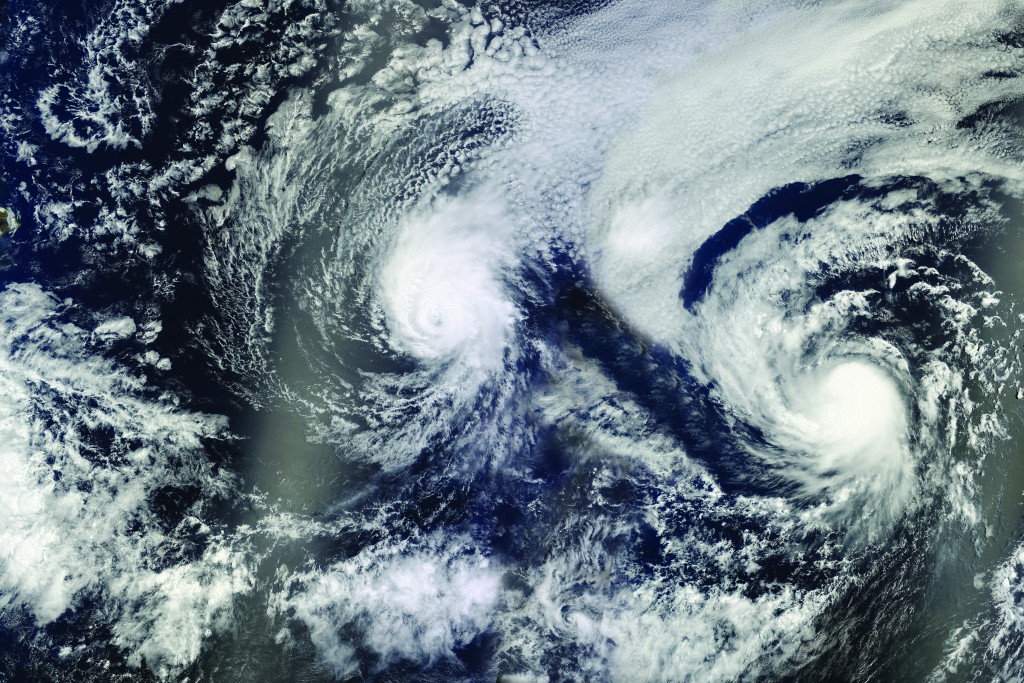
“For example,” Gates says, “all this fresh water coming into the bay from the recent storms will radically shift the chemistry for a period of time, depending on how long that rain event is. That’s why it’s so stochastic and random. Who knew we were going to have these doldrum conditions, and then this massive hurricane backing in with a huge fresh water input. None of that is predictable. In fact, there’s some evidence from the Great Barrier Reef that some of the biggest damage to the reef has been caused by these sorts of random things that are weather related. We can relate all these anomalies to climate change, but they’re nonpredictable effects.”
Maybe it doesn’t matter if a particular event is signal or noise. The important thing to remember about climate change is that it’s characterized by trends. According to Gates, those trends don’t bode well for Hawaii’s stressed corals.
“They need time to recover,” she says. “But if you have a lot of events happening, one on top of the other, you’re going to basically exhaust the system, and the ability of the corals to recover will be compromised. It’s very important to have time between events. But the unfortunate reality is that climate change is definitely increasing the frequency of major events that could potentially impact corals. It’s a bit depressing.”
Gates, though, is the rare optimist among climate researchers. Where others see three-quarters of Kaneohe Bay’s coral bleaching, she’s more interested in the one-quarter that isn’t. Much of her research is focused on explaining why some corals are more resilient to climate stress than others – even when both corals are of the same species. In fact, her lab recently won the prestigious Paul G. Allen Ocean Challenge award for a proposal to expand the population of these super corals by using an approach she calls “human-assisted evolution.” In the GMO era, that’s potentially controversial terminology; but Gates has no plans to fiddle with the genome of corals. Her plan is to identify these hardy, local corals, subject them to the stresses expected in future climates, then selectively breed and plant those that thrive back on the reef. It’s old-fashioned husbandry, and one of the few bright spots in Hawaii’s climate-change odyssey.
Temperatures, wind and rain
Probably no scientist has developed more data on climate change in Hawaii than Tom Giambelluca, a professor in UH’s geography department. For nearly three decades, Giambelluca and his lab have used a network of gauges and weather stations around the state to collect data on temperature, rainfall, evapo-transporation and UV radiation. The result has been a series of published papers outlining a grim future for Hawaii.
“One of the things that my lab has done,” he says, “is to look at the historical records to see if there have been significant changes that we can attribute to climate change. For example, in 2008, we published a paper on temperature trends in Hawaii showing a long, gradual increase in temperature over 80 years, and then a very steep increase in temperature for the past 30 years.”
Such an increase has real consequences in the environment. For example, in a 2014 paper in the journal Global Change Biology, researchers (including Giambelluca) describe how warmer weather at higher altitudes is expanding the range of avian malaria in Hawaii. Mosquitoes, the only vector for avian malaria, used to be confined to areas below 5,900 feet because they couldn’t tolerate the cooler temperatures at higher elevations. This provided a refuge for some of Hawaii’s rare and endangered birds.
But, as higher elevations warm, researchers have found a thriving population of mature mosquitoes and their larvae high on the Alakai Plateau, on Kauai. More important, they’ve observed a doubling in the number of birds infected with the disease. Since avian flu is one of the principal causes of mortality for many Hawaiian birds, this change could prove disastrous
Yet, Giambelluca can’t be certain that the warming trend described in his 2008 paper is signal or noise. “At that time,” he says, “The data was only up through 2006. In recent years, though, temperature hasn’t been up; it’s been flat.” This would make the observed temperature variations seem to closely follow the trends of the Pacific Decadal Oscillation, a regular, long-term cycle of oceanic warming and cooling.
On the other hand, Giambelluca points out, scientists have a poor understanding of the PDO, because only two complete cycles have passed in the time for which there are good records.
“When you have so few ups and downs,” he says, “and you’re trying to find a trend in there, it’s sensitive to where you start and end. If you start at a peak and end, one-and-a-half cycles later, at a low point, you’re going to get a downward trend. But, if you start at a low point and stop at a peak, then you get an upward trend. That’s called ‘aliasing’ – falsely detecting a trend in something that’s really just going up and down. We want to be careful not to be fooled by that type of thing.”
The same goes for rainfall, Giambelluca says. “We’re seeing a drying trend over the long term. This has been published by us and by other groups. But we also see that there are these big fluctuations similar to the temperature fluctuations, and they all seem to be following the PDO.”
Nevertheless, in paper after paper, changes in Hawaii’s environment have been linked to climate change:
• Abby Frazier, one of Giambelluca’s graduate students, identified a drying trend that’s grown stronger over the past 30 years.
• Ryan Longman, another of Giambelluca’s grad students, has documented a steady upward trend in solar radiation at higher elevations, and a corresponding decrease in cloud cover. Both phenomena seem to be the result of changes in the altitude of the trade-wind inversion, which governs cloud formation in Hawaii.
• In 2013, Paul Krushelnycky, a researcher at UH’s College of Tropical Agriculture and Human Resources, published a paper in the journal PLoS ONE showing a connection between the changing rain patterns on higher elevations of Haleakala and the decline of endangered silverswords there. Not surprisingly, Giambelluca was a coauthor of that paper.
• Maoya Bassiouni, a researcher at the U.S. Geological Service, documented that decreased rainfall has led to lower base flow in Hawaii streams, “which had decreased by 20 percent to 70 percent at eight out of nine long-term streamflow gauges in Hawaii over the last 100 years.”
Any one of the effects observed by Giambelluca, his colleagues and others – warmer temperatures, fewer trade winds, less rainfall etc. – may be due to natural variation. But, taken collectively, it’s hard not to see them as evidence of climate change in Hawaii. Put another way, there seems to be more than enough signal to overcome the noise.
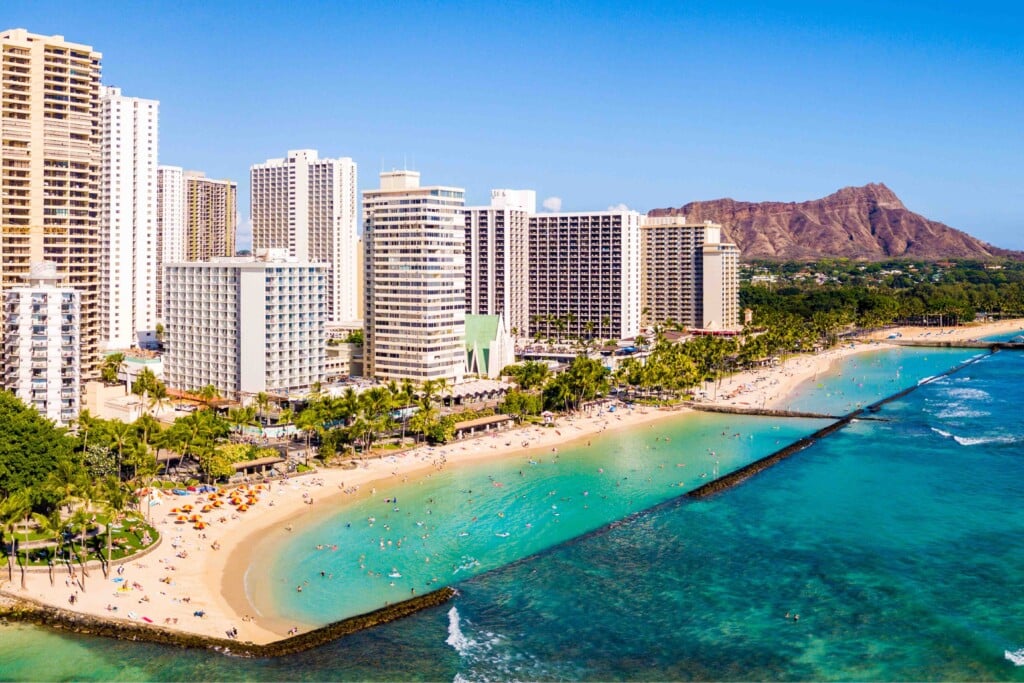
Hawaii’s Beaches Eroding
As we’ve seen, Hawaii’s scientists view climate change as a cascading series of interrelated threats and crises. For most people, though, the most familiar threat is probably rising sea level. Because much of the world’s population and critical infrastructure are coastal, modern civilization is vulnerable to even a modest change in sea level – especially when combined with storm surge and rising water tables. Hawaii is no different. Three feet of sea level rise – which the Intragovernmental Panel on Climate Change predicts by the end of the century, and people like Camilo Mora expect even sooner – would inundate most of our beaches. Large swaths of Waikiki, Kakaako and downtown Honolulu would be submerged at high tide or during strong storms. All our ports would be devastated, as would power plants, oil and gas pipelines, sewage treatment plants and coastal highways. Billions of dollars in oceanfront real estate would become worthless, victim of coastal erosion or outright submergence. With six feet of sea-level rise or more, which some climate models predict, Hawaii would be crippled.
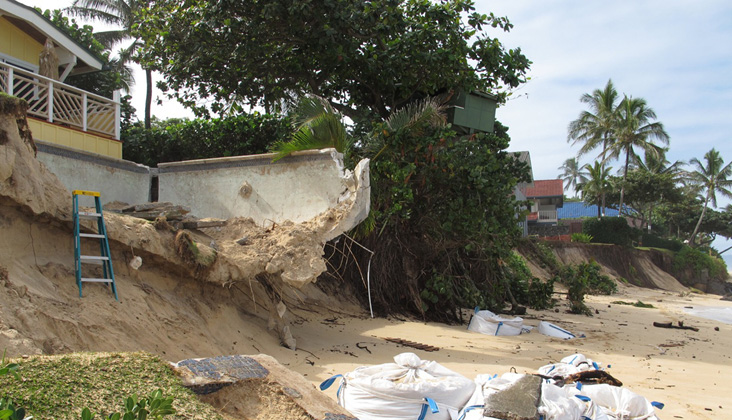
Beach erosion at Sunset Beach on Oahu’s North Shore. Photo: Courtesy of Cliff Fletcher
Sadly, rising sea level is not mere conjecture.
“Sea level is definitely rising,” says Chip Fletcher, who leads the Coastal Geology Group at UH. “We have tide gauges in Hawaii that document that it’s been rising at about six inches per century. And Hawaii is actually doing pretty well. The global average of sea-level rise is now about a foot per century.” Most models suggest the rate of sea-level rise will only increase with global warming.
Even so, Fletcher points out it’s difficult to tease out how much of this rise is explicitly due to climate change.
“The melting of Greenland ice, the melting of Antarctic ice, the melting of glaciers in the mountains, and the warming and expanding of the ocean – those four things are causing global sea level to rise. But, superimposed on this global sea level rise is local and regional variability.”
A fascinating source of variability in the rate of sea-level rise – one that’s unique to Hawaii – is the sheer mass of the Big Island, Fletcher says.
“The volcanoes there are in the process of bending the sea floor, bending the Pacific Plate down. So, the island itself is actually subsiding, even while sea level around it is going up. On the other hand, Oahu is not subsiding, though sea level is still going up around it. That means the rate of sea level rise around the Big Island is twice as fast as the rate of sea level rise around Oahu. Maui falls in the middle.” So, the rate of sea-level rise is 6 inches per century on Oahu, 9.5 inches per century on Maui, and about a foot per century on the Big Island.
Six inches to a foot may not seem like much, but, statewide, Hawaii’s shoreline is retreating about a foot a year in the face of the unrelenting rise in sea level. The consequences can be dramatic. We’ve all seen the images of waves lapping at the feet of Waikiki’s resorts and of million-dollar mansions on the North Shore teetering on the edge of deeply eroded dunes. But, even Fletcher, one of the most prominent oracles of climate change in Hawaii, is reluctant to attribute any particular episode of beach erosion to sea level rise.
“On Oahu,” he says, “we see about 60 percent of the beaches eroding. Eighty-five percent of the beaches on Maui are eroding. On an islandwide basis, this greater rate of erosion is attributable to sea-level rise. But, when we look at it beach by beach, we can’t suss out what component of that change is due to sea-level rise. For instance, Kailua Beach has been accreting more sand over the last 100 years, despite the rising sea level. (Not to mention the well-publicized episodes of erosion on the south end of the beach.) Really, beach health is about sand availability. Some beaches have it, and some don’t. And you can have so much sand available that that can dominate the shoreline position, even when there’s rising sea level.
“What that means is you can’t point at a highly eroded beach, like Sunset Beach, and say, ‘That’s the result of sea-level rise.’ Sea level rise is certainly playing a role, but we can’t be certain whether it’s 5 percent or 90 percent. It’s probably not 90 percent at Sunset, because the heavy erosion that occurred there last year was associated with waves coming from a slightly different direction than normal and pushing the sand in a different direction. But a wave event like that may be the catalyst that disturbs the whole beach system so that sea-level rise can play a larger role. We’re seeing Sunset Beach erosion happening again right now; and, again, we don’t know if that erosion is because waves are coming from a different direction, or whether Sunset just continues to suffer from last winter.”
In other words, like most Hawaii scientists, Fletcher is confident that climate change is happening, but is just not sure about its particular features.
“There is definitely decreased rainfall, rising air temperature, and sea-level rise,” he says. “But all of these are characterized by variability as well as trends. I wouldn’t say that our decreased rainfall and increased temperatures aren’t part of the story. I think they are. It’s just that we have to be aware there’s variability within those trends.”
To emphasize the reality of climate change in Hawaii, he adds, “Sea-surface temperature is definitely rising. We know this conclusively from the HOT data at ALOHA Station. I’m afraid there isn’t a lot of variability to tell you about there. That, as well as ocean acidification, is a real solid trend, unfortunately.”
What to Do
How do we deal with the issue of signal versus noise? For scientists, it’s something to acknowledge, but not be paralyzed by.
“Globally, sea level rise has accelerated and is rising fast. Air temperature rise has accelerated. Storminess has accelerated,” Fletcher says. “Despite variability, it’s prudent to plan. It’s prudent to plan for reduced rainfall, for example. It’s prudent to plan for higher air temperatures, for ocean warming and ocean acidification, for sea-level rise and coastal erosion. After all, we have the benefit of the rest of the world’s data as well. And although ours might be contaminated by variability, on a global average, a lot of that variability goes away.
The trick to dealing with variability, says Axel Timmermann, a climate modeler at UH’s International Pacific Research Center, is to embrace the stochastic, or random, nature of climate. He understands that nearly all the details of what we know about climate change in Hawaii are provisional. But that doesn’t mean they’re meaningless. You simply have to weigh decisions differently. That’s true for scientists and for policymakers.
“Eventually,” Timmermann says, “someone will have to teach the decision makers about making decisions under the shadow of uncertainty. There are some good examples of this. We do it with weather predictions, right? People make a decision to bring an umbrella based on the rainfall forecasts they hear on the radio.” That’s uncertainty.
“Of course, it doesn’t cost them anything if they’re wrong. But, if you want to pour the concrete for the foundation of a building and it rains that day, you could have a real economic loss. You want to pick a day when it’s supposed to be dry, so you pay attention to these probabilities.”
That’s making decisions when things are uncertain.
Like Fletcher, Timmermann speaks of contingency plans as we figure out what to do about climate change. “I think it’s good to prepare for both a best-case scenario and for a worst-case scenario,” he says. “Maybe we don’t have to build a dike here right away, but we have to have plans ready for situations where sea level rises much more rapidly than we expect – maybe because a big piece of Antarctic ice has fallen into the ocean.”
That, too, is dealing with uncertainty.
Timmermann has one more piece of advice: The real issue isn’t the probability of something happening; it’s the risk – the product of probability and the potential damage.
On a whiteboard, he sketches a normal distribution of current estimates for sea-level rise. At the top of the bell curve are our best estimates: between one foot and three feet of sea-level rise. One tail of the curve, though, indicates the likelihood of a much more dramatic rise of six feet or more. “A very low probability,” Timmermann says, “but it’s still not zero.”
In other words, low probability, but massive damage if that long shot happens. “If we knew there was a 10 percent probability that, by the end of the century, sea level was going to rise nine feet instead of three feet, the damage would be enormous. I would say nine feet would bankrupt Hawaii. So, a 10 percent probability is not a tiny risk. This is why I think we need to think best-case, worst-case.”
That’s a climate modeler’s perspective on variability in the real world. The simulated world of climate models isn’t a source of doubt for scientists, it’s a tool for better understanding. Tom Giambelluca emphasizes this.
“It’s not a question of whether something is going to happen,” he says. “We are as sure as we can be that things are going to change here, and they’re going to change in ways we should try to anticipate. But to sort it out takes a lot of work. We’re never going to be able to get a complete, conclusive answer for how things will change in the future. But the answer will presumably get better and better – or, in this case, worse – as we continue to do this work.”
Climate Hiatus No Longer on Hiatus?
What seems random in the short run sometimes becomes clearer with more time or data.
One example might be the so-called Global Warming Hiatus. Between 2000 and 2013, the Earth’s long-term warming trend appeared to pause, puzzling scientists and providing fodder for climate-change deniers. But Axel Timmermann, a climate researcher and modeler at UH’s International Pacific Research Center, may have solved the mystery. He points out that, even during the Hiatus, global land temperatures still went up; it was a lag in sea surface temperatures that caused the pause. After analyzing newer data, though, Timmermann says the pause appears to have ended.
“This summer, global mean sea surface temperatures were the highest ever recorded. And most of that heat was in the North Pacific. It’s crazy. These are temperatures we’ve never seen before.”
Timmermann has a theory about this remarkable heating. He says unprecedented tradewinds at the equator have been pushing warm water ahead of them into the Western Pacific. (This accounts for much of the sea level rise in places such as Tuvalu, where residents may soon become climate-change refugees.) Now, this warm water has migrated to off the coast of the U.S. Northwest, where it’s releasing enormous amounts of heat – heat that Timmermann says has been locked up in the tropical Pacific for almost a decade.
If he’s right, that’s a long time to wait for a signal to emerge from the noise. Of course, if he’s wrong, this year’s warming in the North Pacific may prove to be a fluke, one more episode of variability for scientists to consider.