Checking a decade of Hawaii’s economic forecasts
Hawaii’s economy is hard to predict. Hawaii Business compared a decade of annual economic forecasts against the actual numbers and found most forecasts correctly predict whether key indicators will rise or fall. But the forecasts rarely get the actual numbers right and are often way off.
Economic forecasting is an inexact science with good reason. The national economy is made up of hundreds of millions of individuals and companies acting and interacting in rational and irrational ways, all the while influenced by a global economy that is even harder to measure and predict.
Furthermore, you can almost always count on the unexpected to happen, and that will tear an economic forecast to shreds in the blink of an eye. “You can get things like a tsunami, an earthquake – or both – SARS, 9/11, and those things are unpredictable. They happen and will happen again,” says Carl Bonham, executive director of the University of Hawaii Economic Research Organization.
Hawaii’s economy, though much smaller than the global or national economies, is almost as hard to forecast. But four local organizations have for years taken up the challenge and issued forecasts of key numbers in the state’s economy. The four are Bonham’s UHERO, the state Department of Business, Economic Development and Tourism (DBEDT), First Hawaiian Bank (FHB) and the state Council on Revenues (COR).
The first three organizations issue forecasts that might be used by businesses and individuals to help plan their coming year. For instance, if visitor arrivals are forecast to rise sharply, a tour company might decide to buy more buses and a restaurant company could choose to expand its Waikiki location.
COR’s quarterly projections of expected state revenue are used to help plan the state budget. Projections of rising General Fund revenue mean the governor or legislators might plan to spend more; a projection of falling revenue means cuts should be seriously considered or new revenue sources explored.
If COR’s projections are too high, the state may end up spending more money than it collects. If the projections are too low, the state might cut more spending or raise more taxes than needed to balance the budget.
Right or wrong, the forecasts from the four organizations each year tend to be similar, because they are all based on the same data.
“You don’t see much variation in the forecasts,” notes Leroy Laney, an economist who has prepared FHB’s economic forecasts for 23 years. “We’ve observed the same economy, the same variables and the same set of circumstances. You don’t have a lot of outliers.” Laney, a former economist for the Federal Reserve and for FHB, is a professor of finance and economics at Hawaii Pacific University.
Bonham, who is a professor of economics at UH-Manoa, says economists tend to under-forecast when the economy is booming and over-forecast when it’s contracting. That, he says, is another reason why economists tend to move together in their forecasts.
“When the economy is booming, nobody ever believes it’s going to grow that fast,” says Bonham. “When that stops, you can’t believe it’s going to turn down as fast as it does. So there is a behavioral economics component to that; you sort of latch on to the current state of the world.”
Like the rest of us, economists are influenced by the news media and reports on consumer behavior and other economic trends. “We’re adjusting to the news all the time, and the news is noisy,” Bonham says. “Noisy” is a term often used to refer to data that seem to be useful in making predictions, but usually are not.
Forecasters may use their different statistical models to predict the future, but much of their data tend to come from the same sources: tourism numbers from the Hawaii Tourism Authority, employment reports and inflation statistics come from the federal Bureau of Labor Statistics, and other data. All of those numbers are imperfect reflections of reality and, by nature, at least a little out of date the day they are issued.
“I think that the way we look at the economy is similar,” says Eugene Tian, who has been working for DBEDT for 20 years and became its head economist in April 2012. Tian says DBEDT forecasts focus on the tourism industry and, to help improve its forecasts, DBEDT invites members of the tourism authority to participate in its forecast meetings.
Despite the similarities in their predictions, Hawaii’s economists say, they do not collaborate on their forecasts or share their statistical models. UHERO and DBEDT each have several staff economists and researchers; Laney works by himself. However, many of them collaborate in the Council on Revenues predictions.
COR was established by the 1978 Hawaii State Constitutional Convention. The intent was to create an appointed body that was independent of the state government to project tax revenues for the state’s executive and legislative branches.
“You really want the integrity of the budget process to be supported by authoritative and credible economic assumptions and forecasts, and the council is the way Hawaii chose to do it,” says Paul Brewbaker of the economic consultancy TZ Economics and a COR member for 18 of the past 23 years.
Hawaii is one of only two states to have such a council. Members serve appointed terms and are not compensated. Bonham is currently a member; Laney is a former member.
“It’s public service,” says Laney. “The only thing you really get out of it, frankly, is the opinions of your colleagues and what they think is coming down the pipe with respect to the economy.”
In the beginning, council members were mostly economists, but others, such as accountants and business people, now serve.
“The balance now has shifted to a more eclectic blend,” says Brewbaker. “It’s important to have different perspectives.”
By law, both the governor and Legislature must consider the council’s forecasts when preparing a budget and its components: appropriations, revenue measures, projections and expenditures.
“Sometimes we will, in our actions, modify the council’s projections,” says state Senate Ways and Means Committee Chair David Ige. “Some Finance chairs or Ways and Means chairs tend to be more optimistic, and some tend to be more pessimistic. I guess that’s the conversation that goes on. We don’t disregard the council’s forecast; we take it into consideration and then we sometimes appropriate less money than the council believes we’ll have as a mechanism of being conservative.”
Others take the COR estimates with a grain of salt. In April 2011, Kalbert Young, the state’s budget and finance director, told the Honolulu Star-Advertiser that COR’s estimate of General Fund revenue was too optimistic and set his own estimate lower.
Young and other budget directors begin planning the executive branch’s budget in July for the next fiscal year. They are supposed to start by using COR’s June forecast, then fine tuning the budget based on the September COR forecast. When going over that budget, the governor is supposed to use the September forecast and then check the January COR forecast before submitting his budget to the Legislature. The March COR forecast, which comes in the middle of the annual legislative session, informs legislators as their budget process moves forward.
“When the Legislature finalizes the budget, it is usually based on the March forecast, because that’s the last forecast before we finalize the budget,” says Ige.
According to Bonham, COR’s methodology hasn’t changed much over the years. As in most forecasting, models are used, but the real starting point is in the mind of each of COR’s seven members, since the process starts with each of them casting an individual forecast.
“Each person’s numbers go into the tax department’s model, and the tax department gives us a result of that,” Bonham says. “They average all of our inputs, run them into the model, and then that’s sort of the consensus forecast, if you will. That produces a set of baseline starting-point numbers, which we then discuss and inevitably change.” However, Bonham notes, the council ultimately decides on the final numbers, not the models, sometimes after some vigorous discussions.
Brewbaker says COR’s numbers help legislators explain their budgeting decisions to the public. “It’s basically really good for finger pointing on occasion,” Brewbaker says wryly. “It’s useful for legislators to have the council around because they can occasionally say, ‘Hey, we would love to help you out and allocate some money your way, but the council tells us there’s only this much money.’ ”
The council is prone to the same ills as other economic forecasters: under-forecasting during booms, and over-forecasting during downturns.
Economists acknowledge the limitations of their predictions: Each forecast of the future is simply an expert’s estimate, based on imperfect measurements of the economy at the time the forecast is issued. Nothing more and nothing less.
“Any forecast is simply what you know at that particular point,” says Laney. “Something could happen the next day that could change things. One year is hard enough, but you have no idea what’s going to happen – nobody does – in the next five years. Anything could happen.”
Economists acknowledge the limitations of their predictions: Each forecast of the future is simply an expert’s estimate, based on imperfect measurements of the economy at the time the forecast is issued. Nothing more and nothing less.
Council on Revenue Forcasts
COR issues forecasts of the state’s General Fund revenues four times a year, but Hawaii Business focused just on the projections made each March for the coming fiscal year, which starts each July 1. We compared the forecasted increase or decrease with the actual increase or decrease in General Fund revenue for that fiscal year. The average error: 5.54 percentage points.
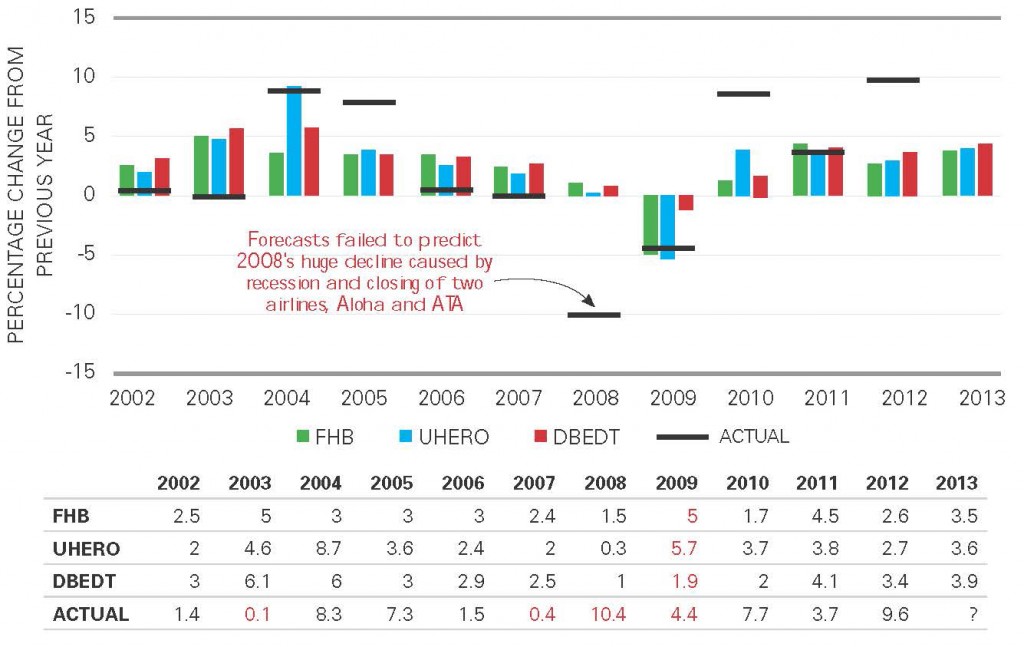
Predicting: Visitor Arrivals
Chart shows percentage changes in visitor arrivals. Visitor arrivals are affected by national and global factors, so economists agree they are the hardest local indicator to predict.
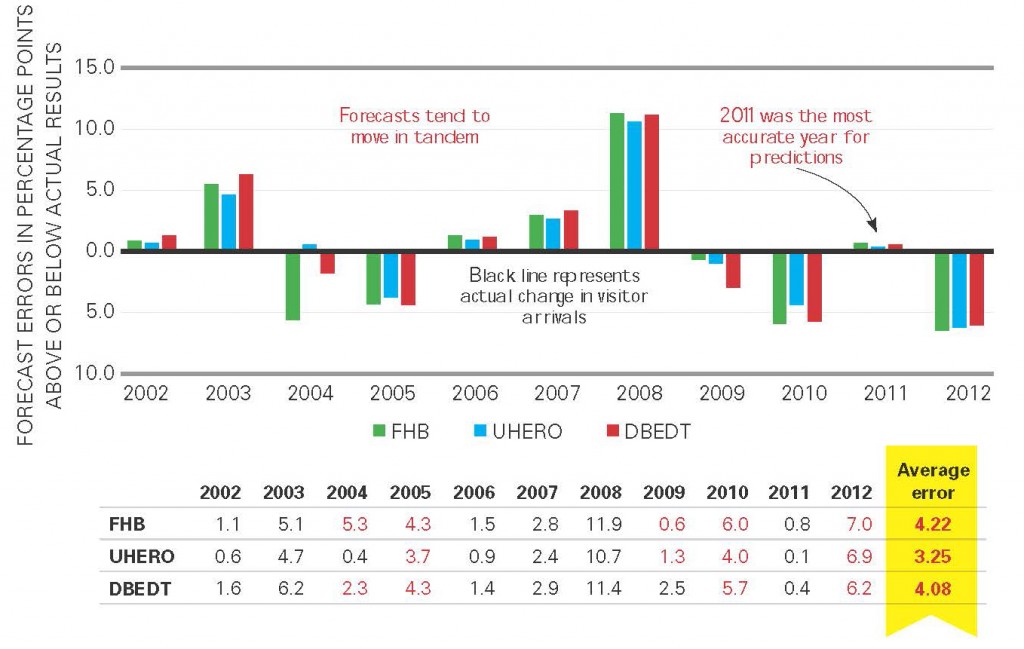
Errors in Visitor Arrivals Forecasts
On average, UHERO’s predictions came closest to reality during the 11 years we surveyed.
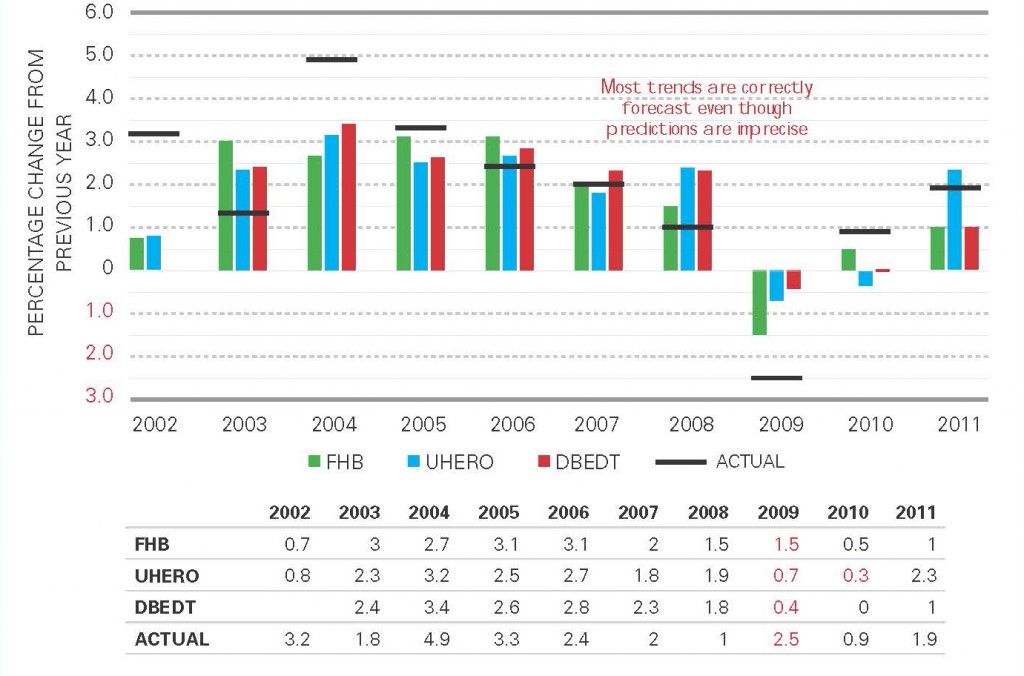
Predicting: Personal Income
Forecasting changes in real personal income after adjusting for inflation
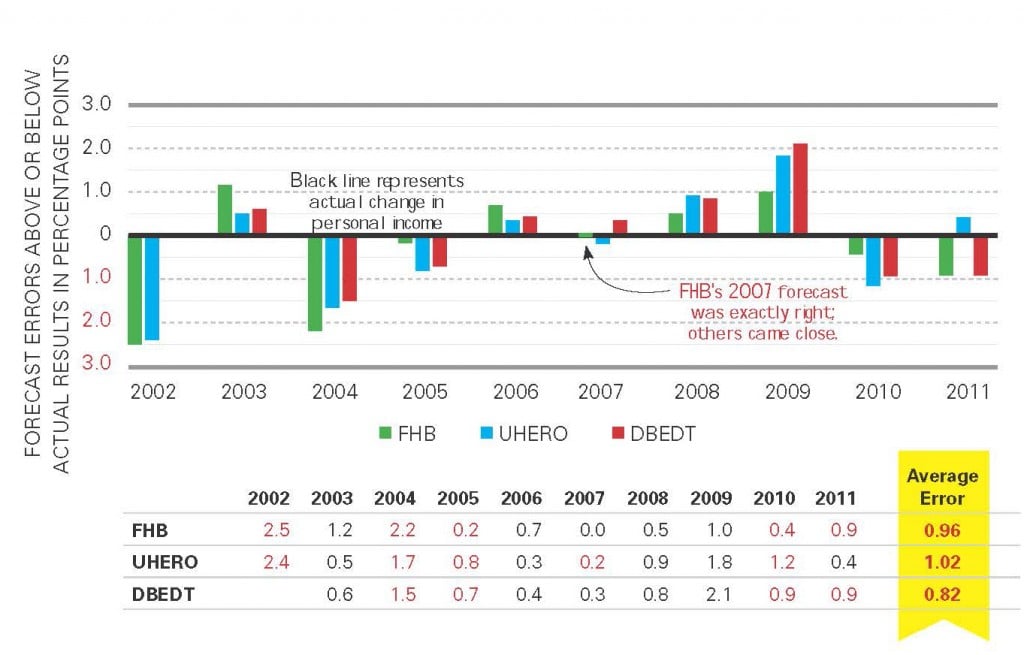
Errors in Personal-Income Forecasts
DBEDT had the most accurate forecasts on average in this category
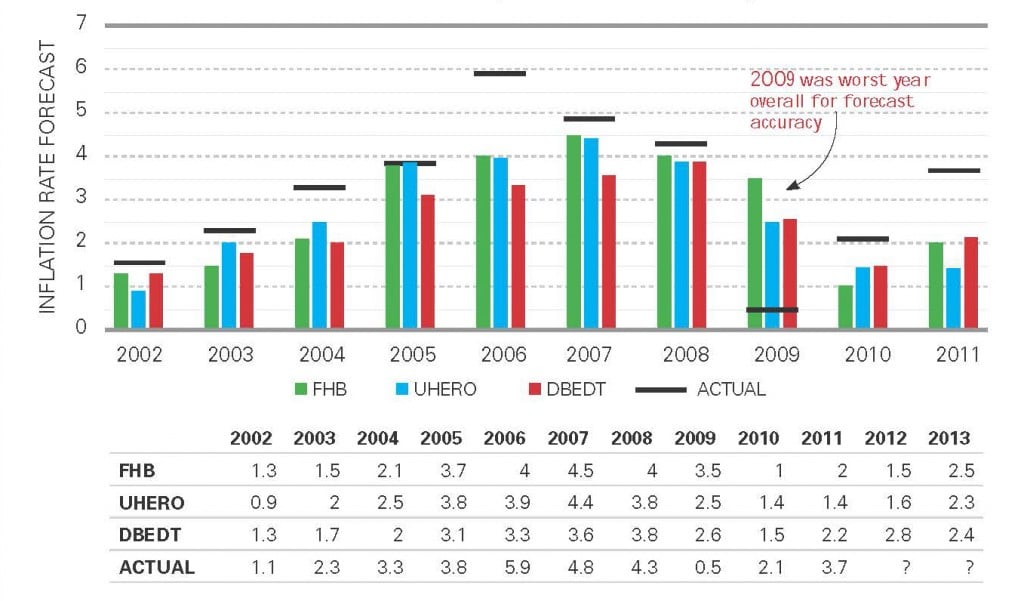
 Predicting: Inflation
Forecasted and actual percentage increases in the Honolulu Consumer Price Index. (There is no statewide CPI.)
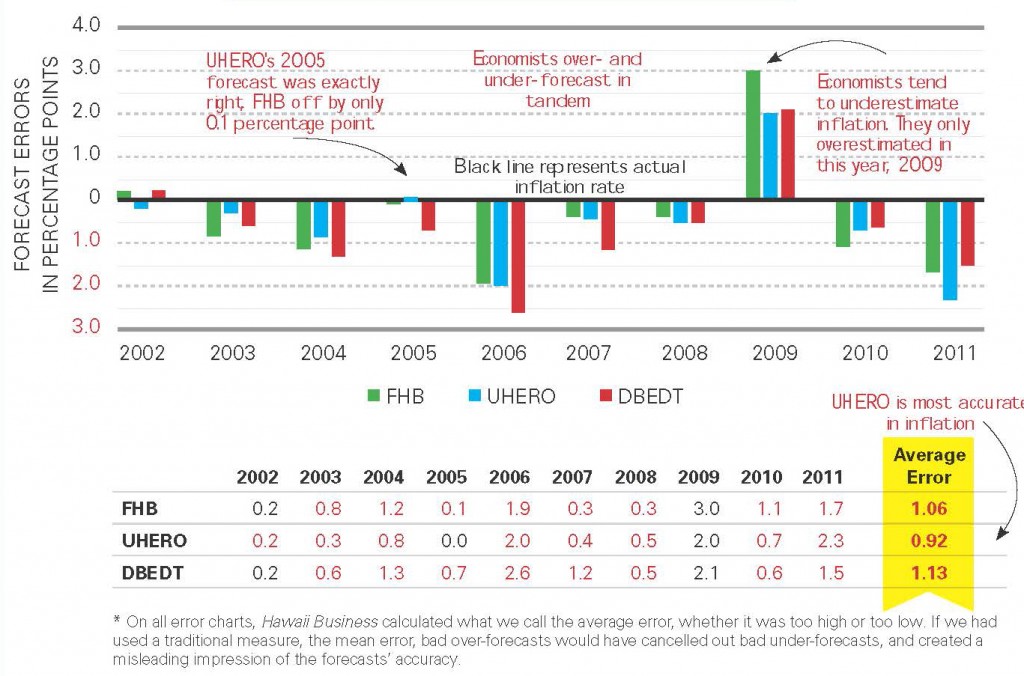
Errors in Inflation Forcasts
* On all error charts, Hawaii Business calculated what we call the average error, whether it was too high or too low. If we had used a traditional measure, the mean error, bad over-forecasts would have cancelled out bad under-forecasts, and created a misleading impression of the forecasts’ accuracy.
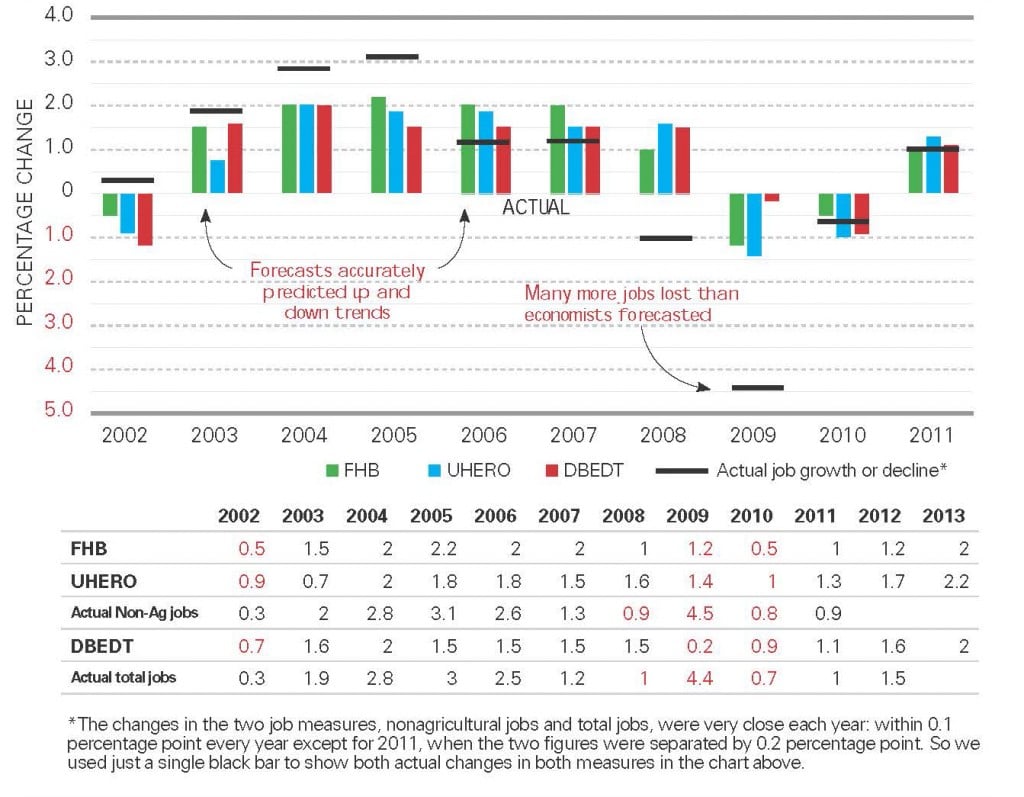
Predicting: Job Growth
First Hawaiian Bank and UHERO predict growth or decline in total nonagricultural jobs; for years, DBEDT forecasted total jobs, a slightly different measure
*The changes in the two job measures, nonagricultural jobs and total jobs, were very close to each other each year: within 0.1 percentage point every year except for 2011, when the two figures were separated by 0.2 percentage point. So we used just a single black bar to show both actual changes in both measures in the chart above.
** Starting with its 2012 forecast, DBEDT began to forecast nonagricultural jobs.
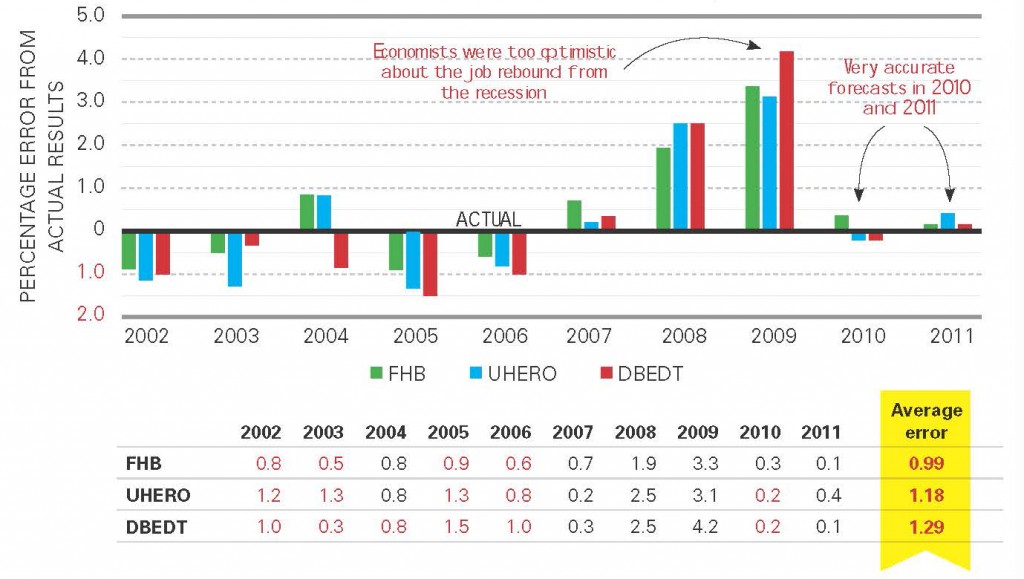
Errors in Job-Growth Forecasts
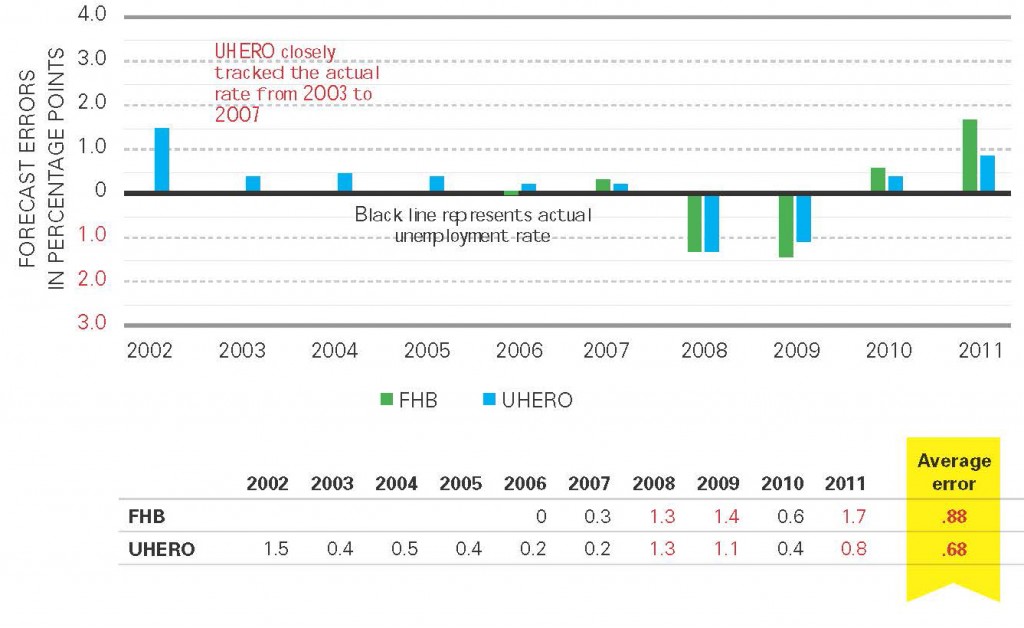
Predicting: Unemployment Rate
DBEDT does not forecast Hawaii’s unemployment rate, but UHERO has been doing it for our entire survey period and FHB started doing so with its 2006 forecast.
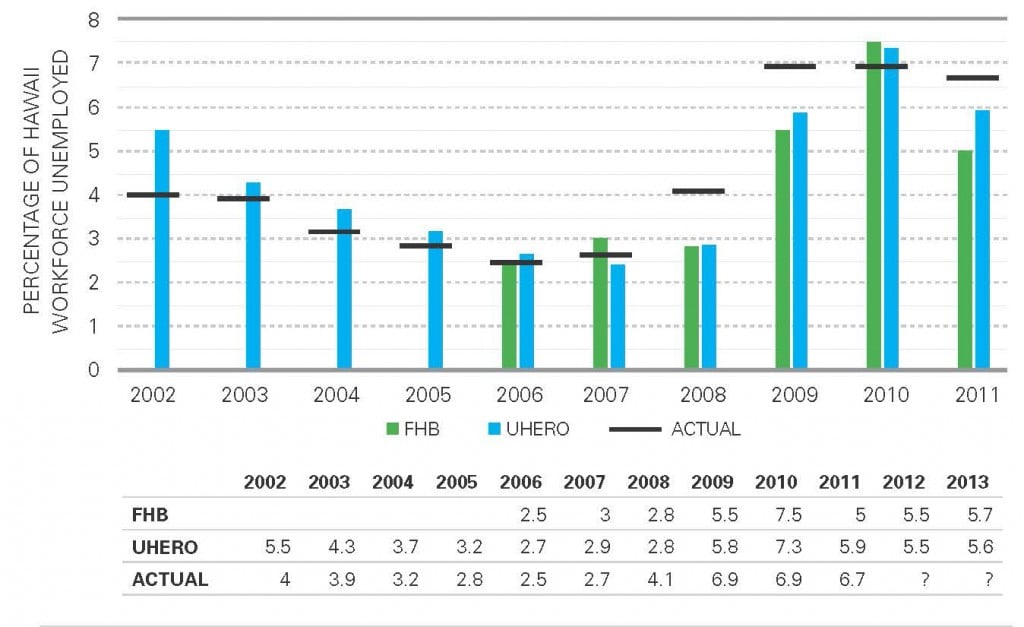
Errors in Unemployment-Rate Forecasts
UHERO is most accurate in predicting the next year’s unemployment rate.
Our Methodology
UHERO and DBEDT issue quarterly forecasts, while FHB releases one annual forecast for the Hawaii economy. Since the FHB forecast is released in the fourth quarter, we took it and the fourth quarter forecasts from the other two and compared them against the actual data for the forecasted year going back as many as 11 years.
The forecasters don’t all project the same indicators. So we’ve compared forecasts of the five most consistent economic indicators: job growth, unemployment, visitor arrivals, inflation and real personal income.
COR meets at least five times a year to issue predictions for state General Fund revenues and personal income. Since the March forecast is the last one legislators see before finalizing the annual state budget, we compared each March’s COR forecast for the coming fiscal year, which begins July 1, against actual General Fund revenues for that fiscal year.
Error rate: To measure errors, Hawaii Business calculated what we called the average error. We did not use a traditional measurement that is called mean error; using that measure, an error that was too high by two percentage points in one year was cancelled out by an error that was too low by two percentage points in the next year. That is misleading. Under our measurement, those two errors are each an error of two percentage points and therefore their average error is two percentage points.
Hawaii Economic Indicators Explained
Visitor Arrivals: A common measure of tourism demand. Represents the number of visitors who travel to Hawaii by air, since more than 98 percent of tourists arrive by plane. The number is determined by subtracting Hawaii residents from the official passenger counts reported by air carriers. The Hawaii Tourism Authority and the state Department of Business, Economic Development and Tourism administer surveys to passengers to identify residents versus tourists on flights.
Real Personal Income: RPI is a measure of income received by Hawaii residents from wages and salaries, dividends and interest, etc.. Growth in RPI is adjusted for inflation and expressed in a percentage.
Inflation: Represents the percentage change in Honolulu’s Consumer Price Index for All Urban Consumers (CPU-U). There is no statewide CPI. The CPI measures the average change in prices over time for a fixed market bag of goods and services that people buy for day-to-day living.
Job Growth: Measured by a survey of businesses and other employers conducted monthly by the U.S. Bureau of Labor Statistics, job growth indicates the number of nonagricultural payroll jobs and is represented by percentage change.
Unemployment: Calculated as a percentage by dividing the number of unemployed individuals currently seeking work by the total number of individuals making up Hawaii’s labor force. The labor force consists of all individuals 16 years or older who are currently employed or are looking for work. This indicator, called the U-3 by the U.S. Bureau of Labor Statistics, is the statistic relating to unemployment that is the most frequently referenced.
Gross Domestic Product: Considered, at least nationally, to be the broadest measure of the economy; however, on a state level, GDP has a long lag, is prone to revision and isn’t considered by Hawaii economists to be a reliable gauge. There are few GDP forecasts to analyze so we left them out of this report. The first state GDP forecast provided by DBEDT was for 2007; UHERO’s first was for 2011 and FHB’s was for 2013.