BOSS Survey: Optimism & Concern
BOSS METHODOLOGY
The Business Outlook and Sentiment Survey (BOSS) was conducted by QMark Research using a list of Hawaii companies purchased from Equifax Polk Business Directory. The sample of companies was stratified based on number of employees. Small businesses were divided into two sub-groups. Businesses with 3 to 9 employees were designated as “very small” and those with 10 to 49 employees were designated as “small.” Medium-size firms had 50 to 99 employees, while companies with 100 or more employees were classified as “large.” The goal was a targeted sample of 100 businesses in each sector.
A total of 403 random interviews on all the major islands were conducted by telephone by professional QMark interviewers from April 13 to April 22. The interview was with the owner or other senior executive listed in the Equifax directory. If that person was not available, the BOSS surveyer asked for “someone who is knowledgeable about your company, either the President/Vice-President or Manager.” The BOSS data were weighted to reflect the proper proportions of each company segment based on number of employees as reported by the state Department of Labor. A sample of this size has a margin of error of +/- 4.90 percentage points with a 95% level of confidence.
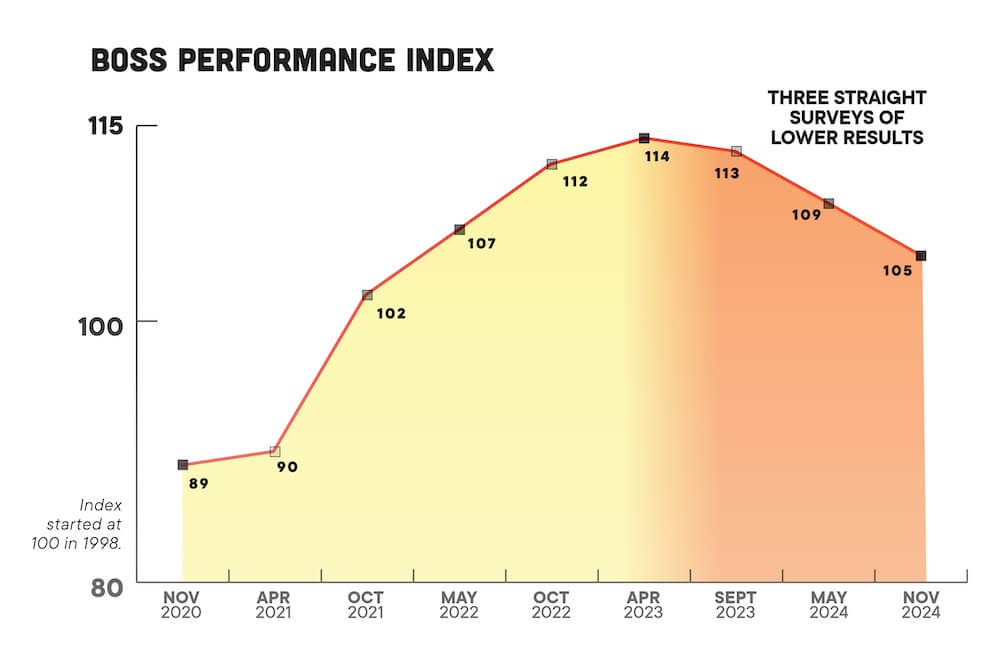
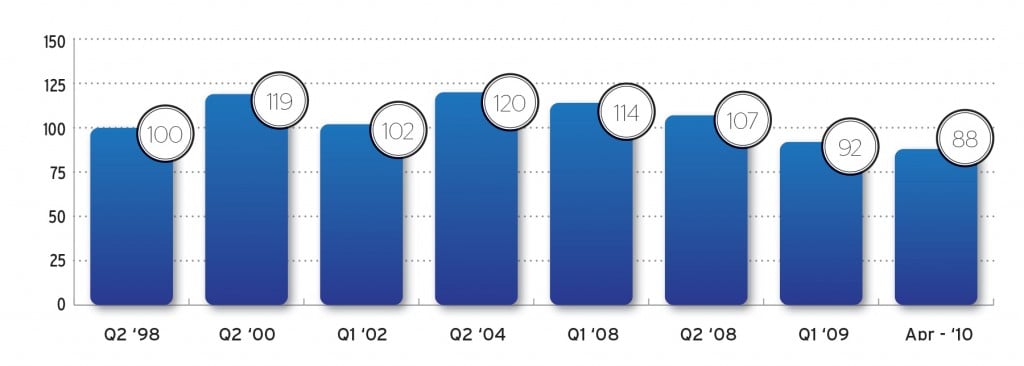
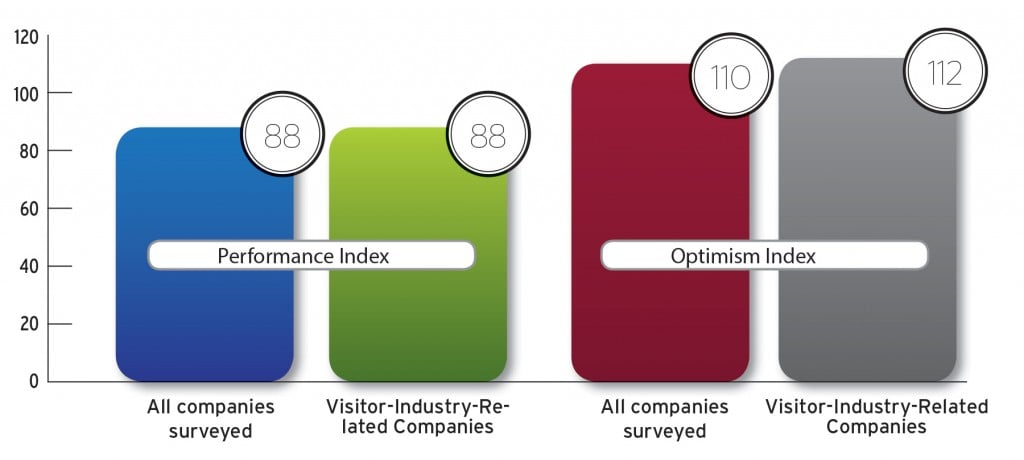
Performance Index
This composite index measures and compiles three crucial factors from all the companies surveyed: changes in staffing, gross revenues and profit before taxes over the past year. It stands at 88, its lowest point in similar surveys conducted by QMark Research over the past 12 years.
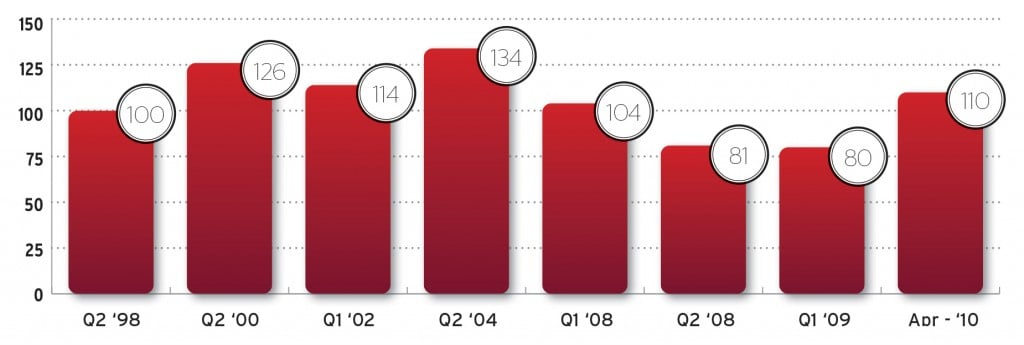
Optimism Index
This index reveals businesses’ outlook for Hawaii’s economic future. It stands at 110, much higher than last year’s all-time low of 80. For a breakdown of the companies’ responses, see “economic outlook” on the next page. Both this index and the Performance Index started in 1998 at a benchmark of 100.
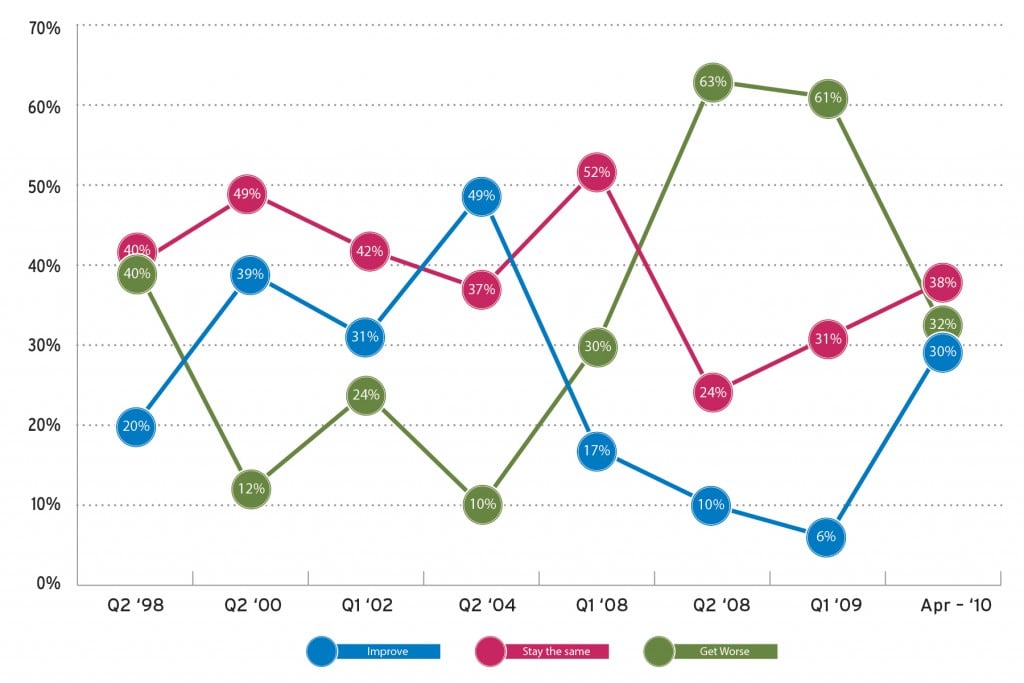
More optimism, but it’s still a minority view
Thirty percent of the businesses polled believe the economic outlook for Hawaii will improve in the coming year. That’s a huge increase from last year. Slightly more (38%) expect little or no change in the economy, while 32% feel things will get worse.
Economic outlook by company size
Generally, the bigger the company, the greater the optimism for the overall economy.
| Very Small | Small | Medium | Large | |
| 3-9 | 10-49 | 50-99 | 100+ | |
| Things will improve … | 32% | 24% | 33% | 36% |
| Things will be about the same… | 33% | 53% | 47% | 48% |
| Things will be worse… | 35% | 24% | 20% | 17% |
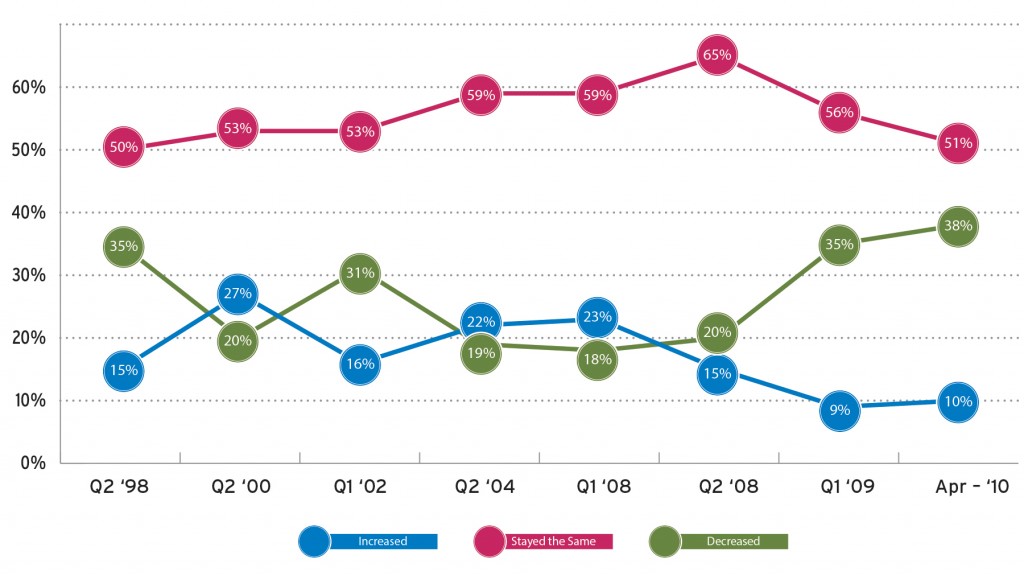
Almost all companies cut staff or held steady
Ten percent of the businesses polled have increased staffing over the past year. Half (51%) say staffing levels have remained unchanged while 38% report declines in their number of employees. Those percentages have changed little from a year ago.
Small companies made fewest changes in staffing
| Very Small 3-9 | Small 10-49 | Medium 50-99 | Large 100+ | |
| Increased | 9% | 12% | 15% | 23% |
| Stayed the same | 52% | 52% | 43% | 38% |
| Decreased | 39% | 34% | 42% | 40% |
Future spending
Everyone was asked which of three statements best describes their firm’s spending plan for the coming year.
One-third (33%) of the businesses polled expect more cost cutting in the coming year. Half expect no substantial changes in spending while 14% expect to see spending increases.
| Apr-10 | |
| Expect substantial increases in spending on capital or other items | 14% |
| Expect no substantial cost cuts and no substantial spending increases | 50% |
| More cost cutting | 33% |
| Don’t know | 4% |
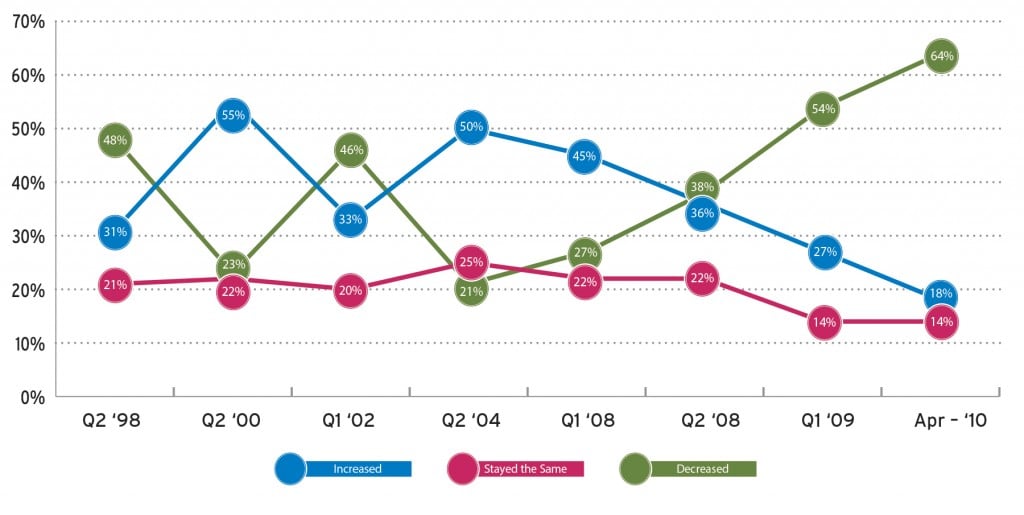
Two-thirds report lower revenues
Eighteen percent of the firms taking part in the study reported increases in gross revenue over the last year. Fourteen percent reported no change, while 64% reported declines. The percentage of declines is the worst in 12 years of these QMark surveys.
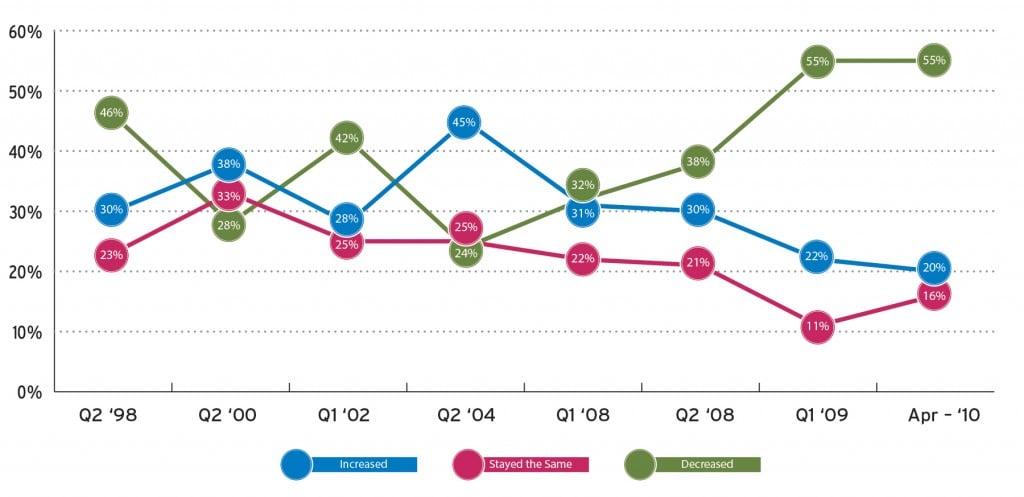
Pre-tax profits down for 2nd year
Twenty percent of the businesses polled report increases in profit before taxes compared to the prior year. Sixteen percent report profits before taxes have remained the same while 55% report a decline. When the data is tracked we find the results relatively unchanged from a year ago.
Visitor industry reflects overall Hawaii economy
We focus here on companies that rely on tourists. Among the 403 firms surveyed, 292 say they get most or some of their income from the visitor industry (19% say most and 46% say some income). Separate indices were run just for these businesses.
Revenue, profit and staffing
Visitor-industry-related businesses were also compared against the overall sample for certain key measurements for the past year.
The research shows two-thirds (62%) of these businesses expect revenues from the visitor industry to remain stable over the next year. Of the reminder, 11% think revenue from this segment will be substantially more while remaining 27% think it will be substantially less than a year ago.
| Overall | Visitor | Overall | Visitor | Overall | Visitor | |
| Gross revenue | 18% | 15% | 14% | 14% | 64% | 65% |
| Profit before taxes | 20% | 19% | 16% | 17% | 55% | 54% |
| Staffing changes | 10% | 13% | 51% | 47% | 38% | 40% |
| Economic outlook | 30% | 32% | 38% | 39% | 32% | 29% |
Forecast for coming year
These same firms were asked to estimate the revenue they will generate this year from visitor industry sales.
| Substantially more than last year | 11% |
| About the same as last year | 62% |
| Substantially less than last year | 27% |
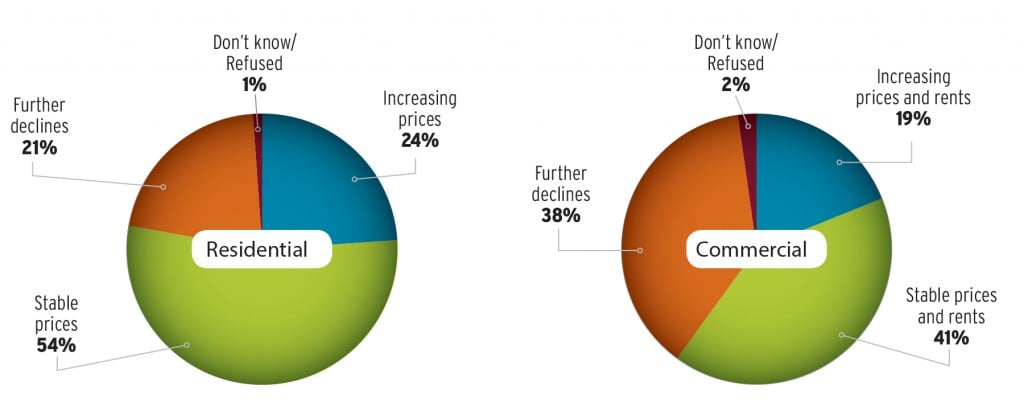
Real estate prices
Businesses were asked for their thoughts on the local real estate market. One in four(24%) respondents feels prices in the residential market will rise in the coming year. Half (54%) feel things will remain stable while 21% expect the residential real estate prices will decline further in the next year.
More businesses thought that commercial real estate prices and rents would decline in the coming year. Nineteen percent think commercial real estate prices will increase along with rental rates. Forty-one percent think they will remain stable while 38% think prices will decline in the commercial sector.
Who we surveyed
Percentages may not add to 100 because of rounding or no reply.
| Total | Very Small | Small | Medium | Large | |
| Business | |||||
| Service | 50% | 50% | 47% | 52% | 55% |
| Retail | 27% | 27% | 28% | 22% | 19% |
| Wholesale | 12% | 12% | 13% | 7% | 5% |
| Manufacturing | 3% | 2% | 7% | 5% | 7% |
| Other | 8% | 9% | 5% | 14% | 13% |
| Office | |||||
| Own | 28% | 28% | 25% | 38% | 32% |
| Lease | 70% | 70% | 74% | 59% | 64% |
| Employees | |||||
| Mean | 19.4 | 5.83 | 25.09 | 68.19 | 411.69 |
| Years in HI | |||||
| Mean | 24.26 | 22.98 | 26.64 | 30.99 | 39.57 |
| Median | 20 | 20 | 21 | 29 | 34 |
| Island | |||||
| Oahu | 68% | 68% | 70% | 69% | 68% |
| Big Island | 7% | 5% | 13% | 12% | 14% |
| Maui | 16% | 17% | 14% | 14% | 14% |
| Kauai | 9% | 10% | 4% | 5% | 4% |