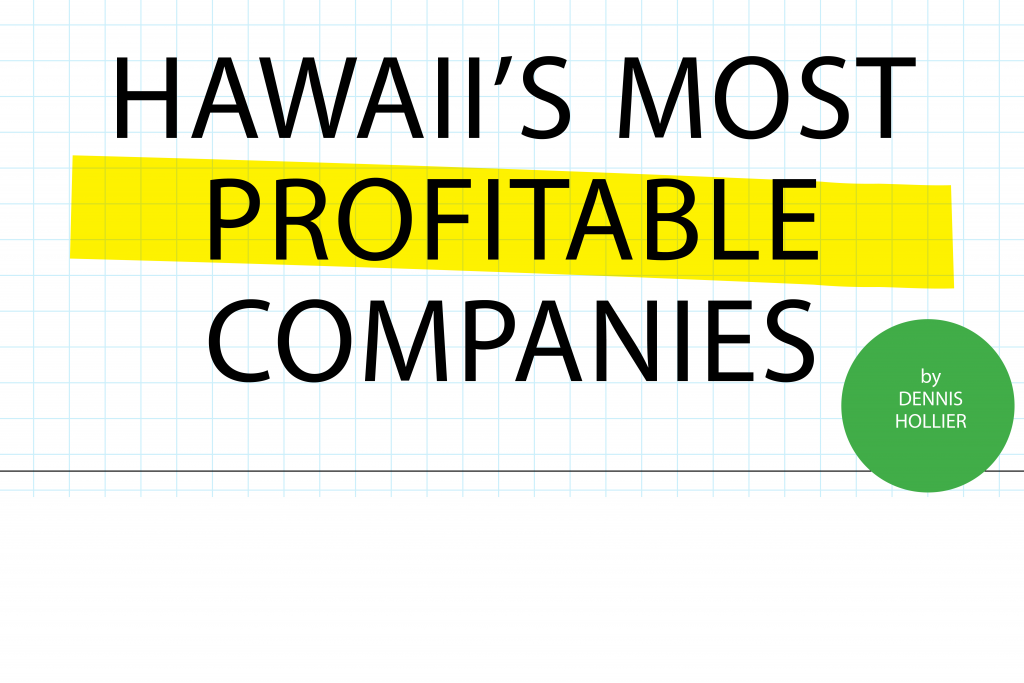
Hawaii’s Most Profitable Companies
For 28 years, Hawaii Business has been publishing a list of Hawaii’s Top 250 organizations based on gross revenues, because we think that’s the most effective way to measure a company’s size.
However, there have always been critics in the business community who believe we should use profits instead. “After all,” they point out, “many of those in the Top 250 actually lost money.” True. Revenues might be a proxy for size, but they’re an imprecise measure of success.
But, profitability presents its own problems. To paraphrase Alvin Toffler, “Profits are like sausage; they’re esteemed most by those who know least about what goes into them.”
Profit is affected by:
• Nuances of the tax code;
• Whether a company is publicly traded or privately held;
• Whether the company is regulated and how;
• How it applies the sometimes arbitrary rules of GAAP, or generally accepted accounting principles;
• Whether it’s in a capital-intensive industry; and
• Even the simple calculus of ownership: “Shall we take profits or shall we reinvest?”
In short, while profits are critical, they’re not always the only or even the most important measure of success. Also, privately held companies are more reluctant to provide their profit numbers to Hawaii Business than their revenue numbers; only 41 of the Top 250 provided their profit information for the list.
Yet, although our profitability list isn’t comprehensive, we were able to collect the financial statements of many of the Top 250 organizations. Some, like nonprofits and government agencies, post their financial reports online. Others are public record, gathered from places like the Securities Exchange Commission, the Federal Financial Institutions Examination Commission and the National Association of Insurance Commissioners.
Collectively, these 990s, 10-Ks and other disclosures provide a fascinating look at which businesses are making (and losing) the most money in Hawaii. We also look beyond the basic data, providing other metrics and analyses to help you make sense of all those numbers.
Hawaii’s Most Profitable
Companies
| Rank | COMPANY NAME | Net Profit (2010) in millions |
| 1 | First Hawaiian Bank | $212.6 |
| 2 | Bank of Hawaii Corp. | $183.9 |
| 3 | Hawaiian Electric | $113.5 |
| Industries Inc. | ||
| 4 | Hawaiian Airlines Inc. | $110.3 |
| 5 | Alexander & Baldwin Inc. | $92.1 |
| 6 | First Insurance Co. of Hawaii Ltd. | $33.5 |
| 7 | Island Insurance Cos. | $13.4 |
| 8 | Maui Land & Pineapple Co. Inc. | $12.5 |
| 9 | Territorial Savings Bank | $11.0 |
| 10 | Zephyr Insurance Co. Inc. | $10.0 |
| 11 | Pacific Guardian Life | $9.9 |
| Insurance Co. Ltd. | ||
| 12 | Hawaii Employers’ Mutual Insurance Co. | $8.7 |
| 13 | UHA (University Health Alliance) | $6.3 |
| 14 | Barnwell Industries Inc. | $4.3 |
| 15 | Farmers Insurance Hawaii, Inc. | $3.9 |
| 16 | Hawaiian Insurance And Guaranty Co. Ltd. | $1.8 |
| 17 | Hawaii National Bank | $1.7 |
| 18 | DTRIC Insurance Co. Ltd. | $1.5 |
| 19 | Cyanotech Corp. | $1.4 |
| 20 | Hawaii Medical Assurance Association (HMAA) | ($2.80) |
Nonprofit Companies
| Rank | COMPANY NAME | Net Profit (2010) in millions |
| 1 | Kamehameha Schools | $436.1 |
| 2 | University of Hawaii | $125.9 |
| 3 | Hawaii Community | $43.3 |
| Foundation | ||
| 4 | The Queen’s Health Systems | $30.8 |
| 5 | Honolulu Board of Water Supply | $17.4 |
| 6 | Hawaii Pacific Health | $14.9 |
| 7 | Punahou School | $13.5 |
| 8 | Kauai Island Utility | $10.0 |
| Cooperative | ||
| 9 | AlohaCare | $6.5 |
| 10 | HawaiiUSA Federal Credit Union | $6.1 |
| 11 | Hawaii Medical Service Association (HMSA) | $5.3 |
| 12 | University of Hawaii FCU | $4.7 |
| 13 | Hawaiian Tel FCU | $4.3 |
| 14 | Hawaii State Federal Credit Union | $3.7 |
| 15 | HFS Federal Credit Union | $2.1 |
| 16 | Aloha Pacific Federal Credit Union | $1.5 |
| 17 | Kaiser Permanente Hawaii | ($5.10) |
| 18 | Hawaii Health Systems Corp. | ($61.80) |
BANKS
First Hawaiian Is Hawaii’s Most Profitable Company
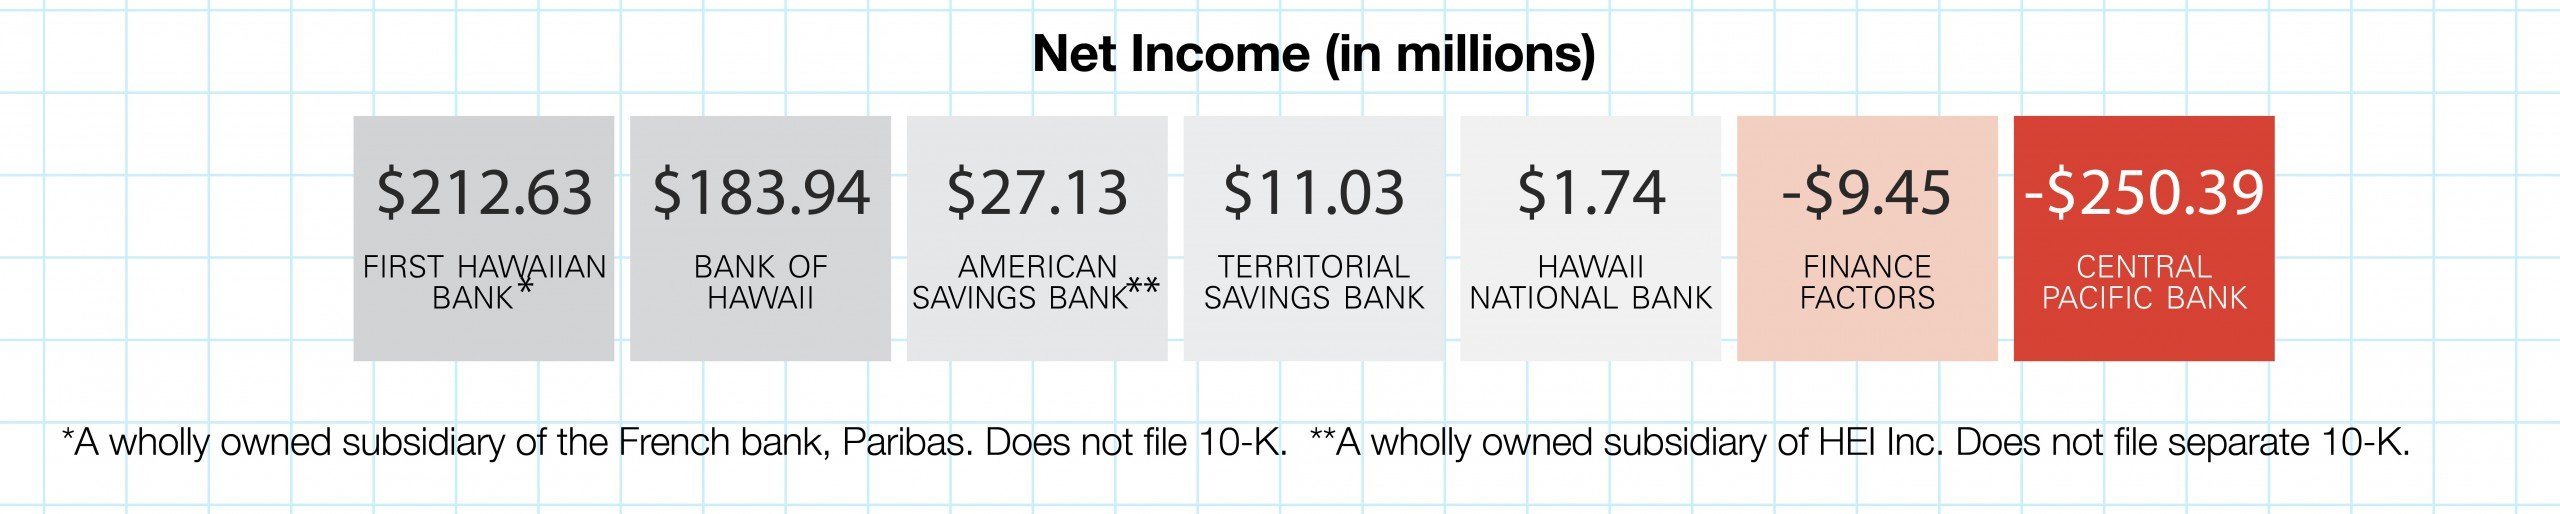
First Hawaiian Bank’s net income of $213 million makes it not just the state’s most profitable financial institution, but the most profitable for-profit company of any type in Hawaii. In fact, as CEO Don Horner gladly points out, First Hawaiian is the state’s biggest bank by almost any measure. FHB has the most total assets, makes the most loans and has more equity capital than all the other banks combined. However, on gross revenue, Bank of Hawaii holds a slight lead on FHB.
Return on Assets
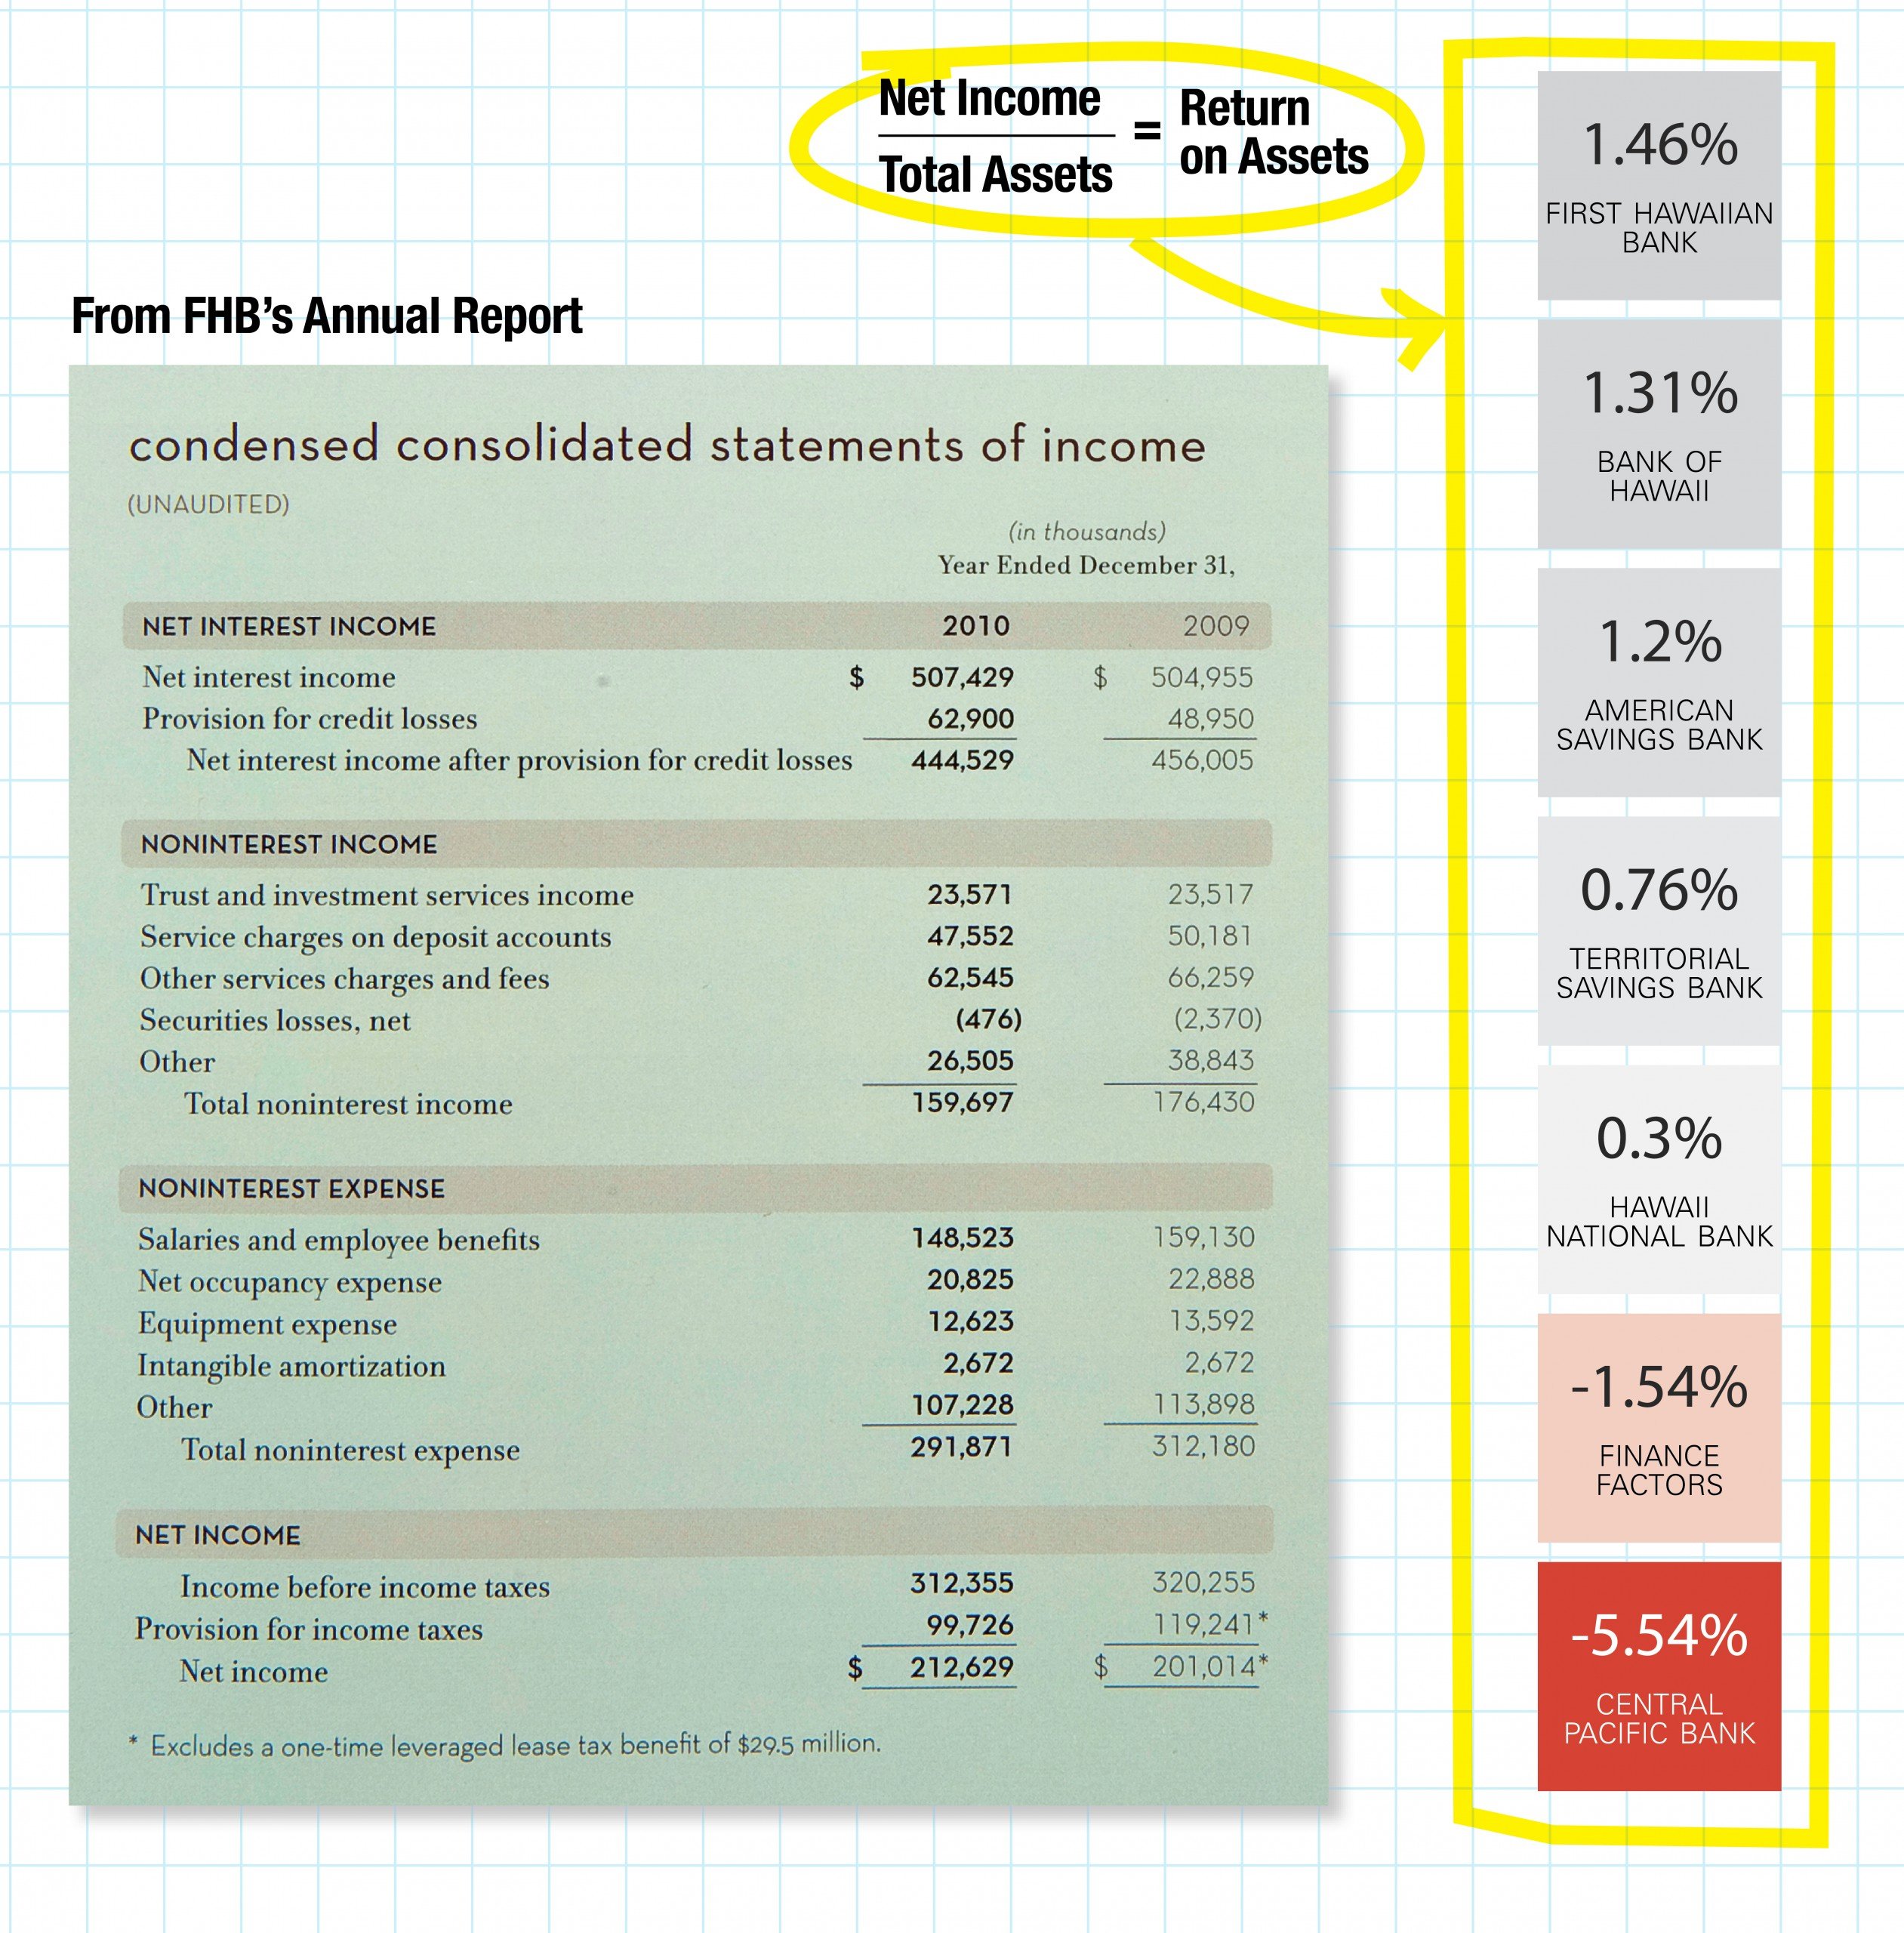
Sometimes, net income can’t tell the whole story about a company’s profitability. That’s why, for example, when analysts look at a company’s financial statements – particularly a bank’s – they’re more interested in ratios and margins. How much did the company make compared to its assets or its expenses? These figures, sometimes buried deep in a company’s annual report or SEC filings, make it possible to compare companies of different sizes or, sometimes, different industries.
Return on assets, net income divided by total assets, indicates how profitably a company deploys its resources. By this measure, FHB is still Hawaii’s largest bank, but its lead has diminished.
Bank of Hawaii Leads in Return on Equity
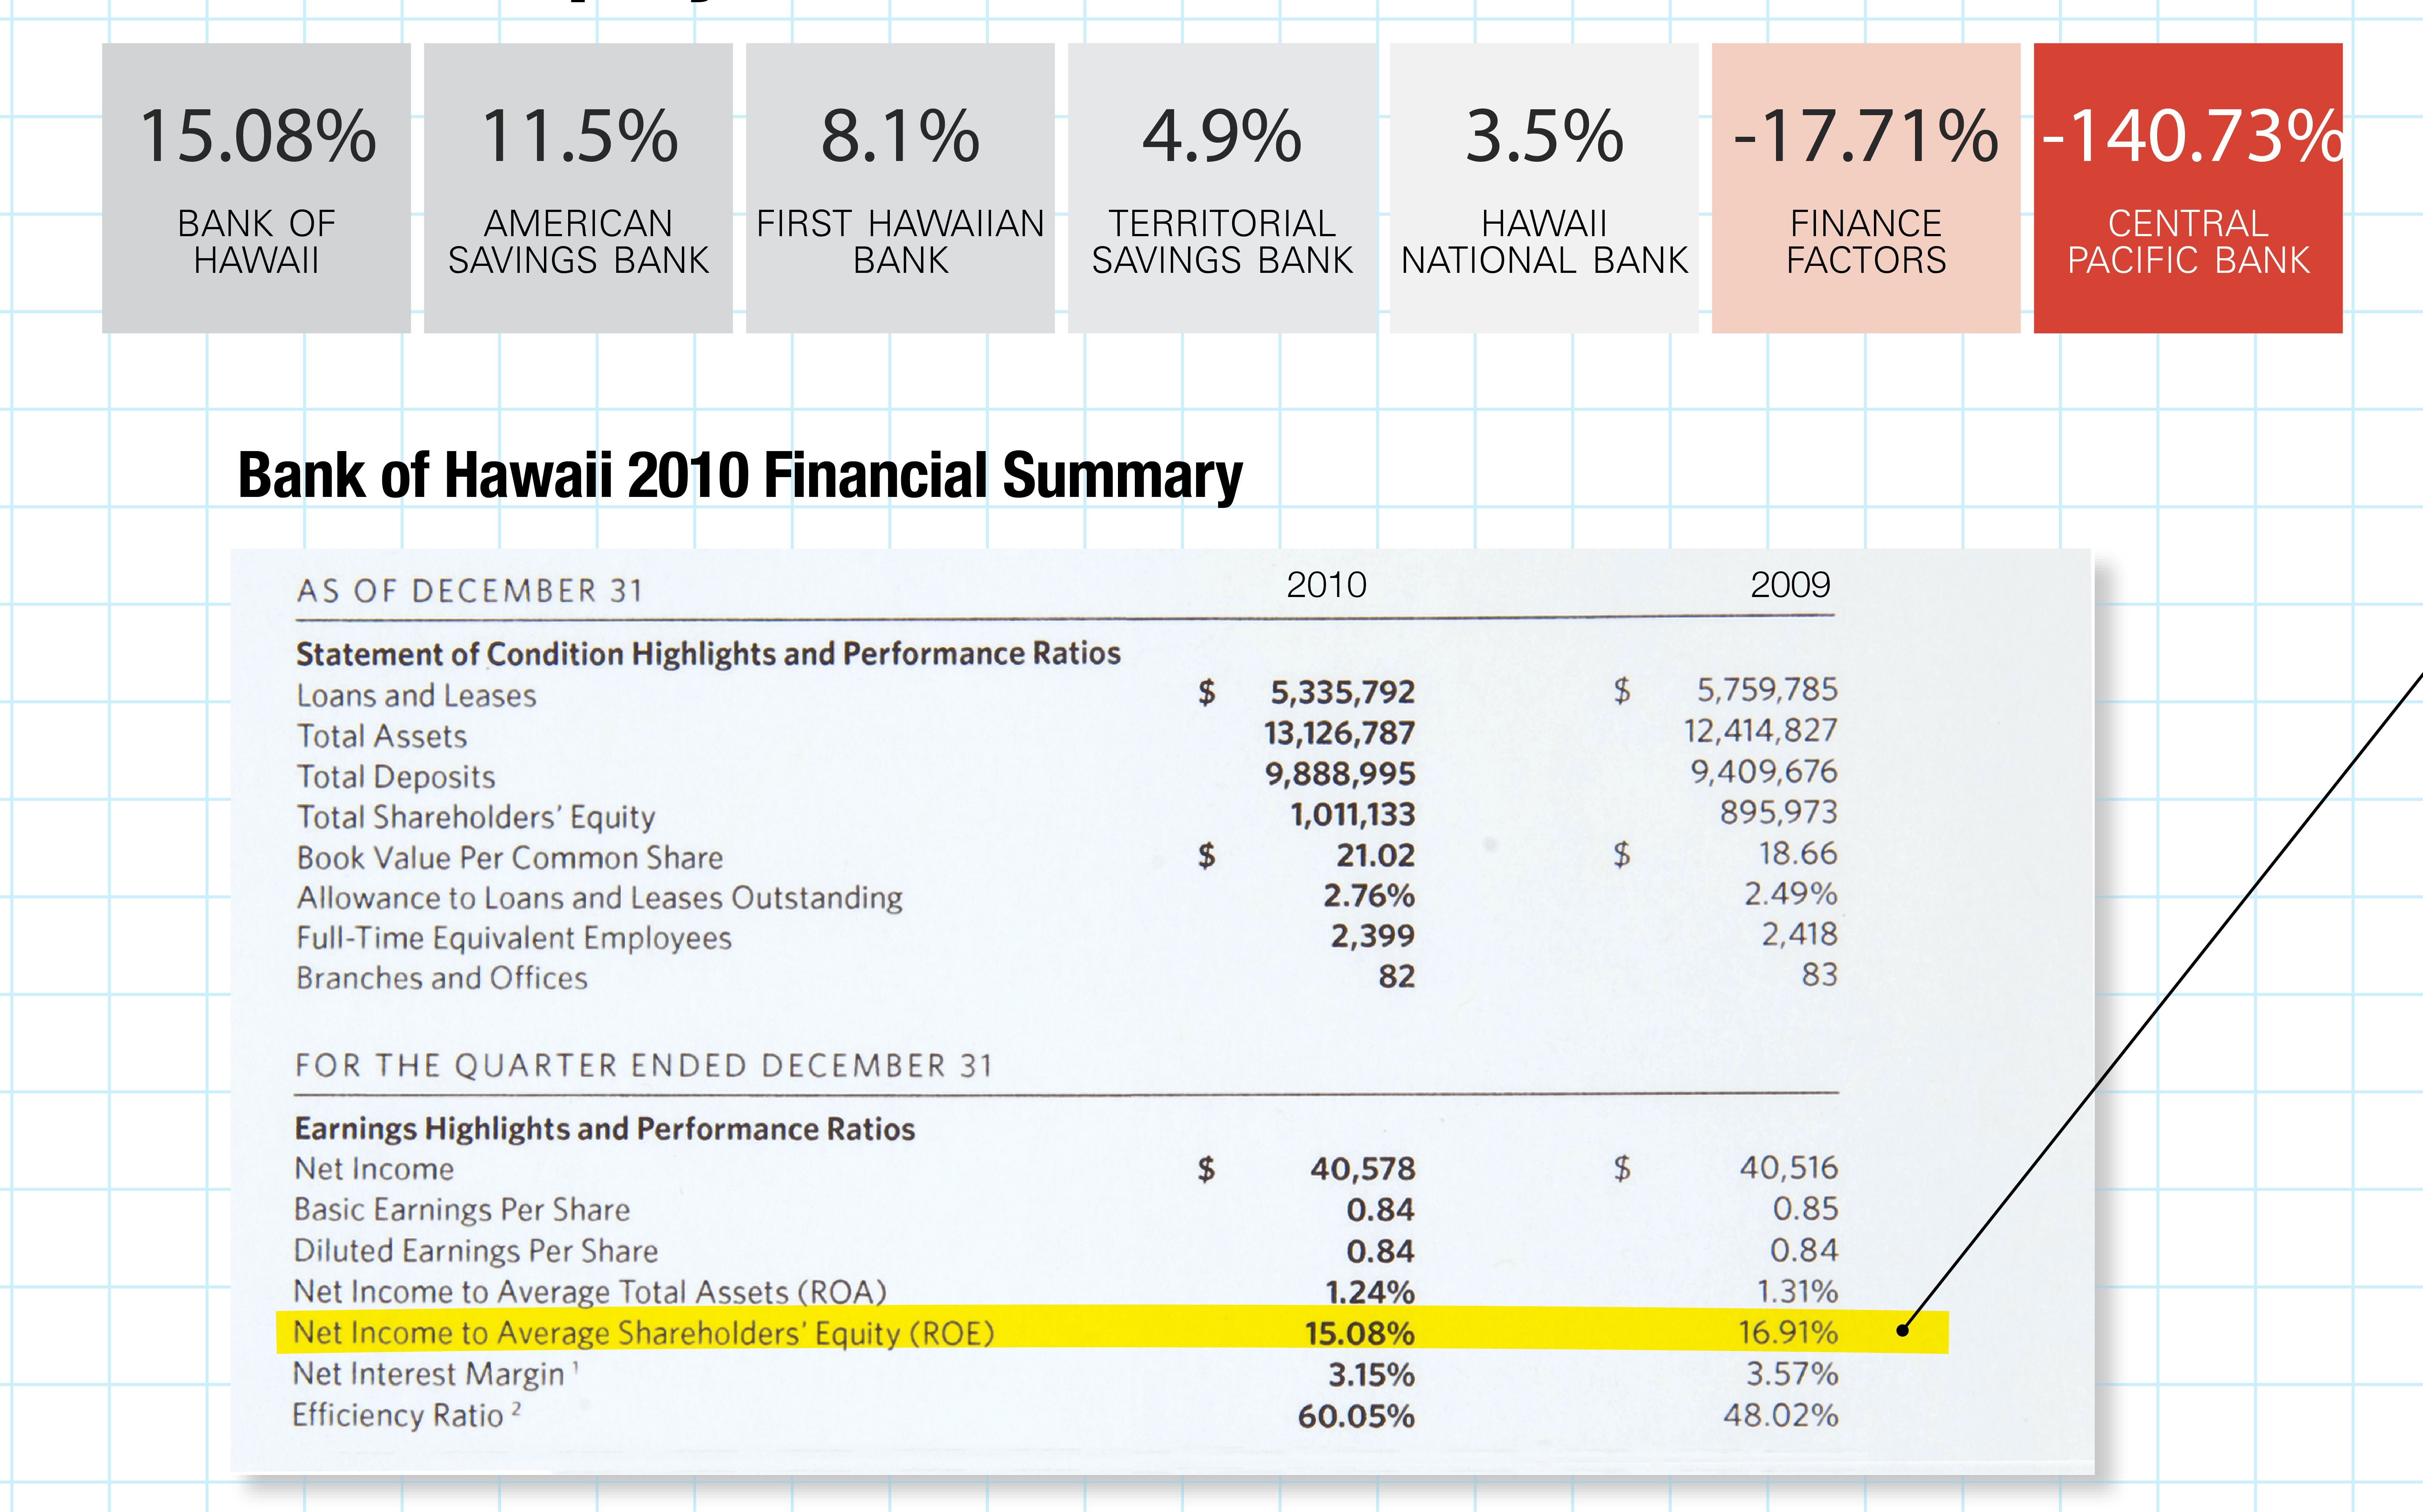
Investors may be more interested in how much profit a company makes compared to its capital, a figure called return on equity. “In our case, that’s historically been quite an attractive number,” says Kent Lucien, CFO of Bank of Hawaii. Jeff Rulis, an analyst who covers the bank for D. A. Davidson, agrees. “For the full year, they ended with an ROE of around 15 percent. That’s outstanding for the bank space right now. The majority of banks are struggling to get to double figures, or even just to stay positive.”
Quality vs Quantity Income
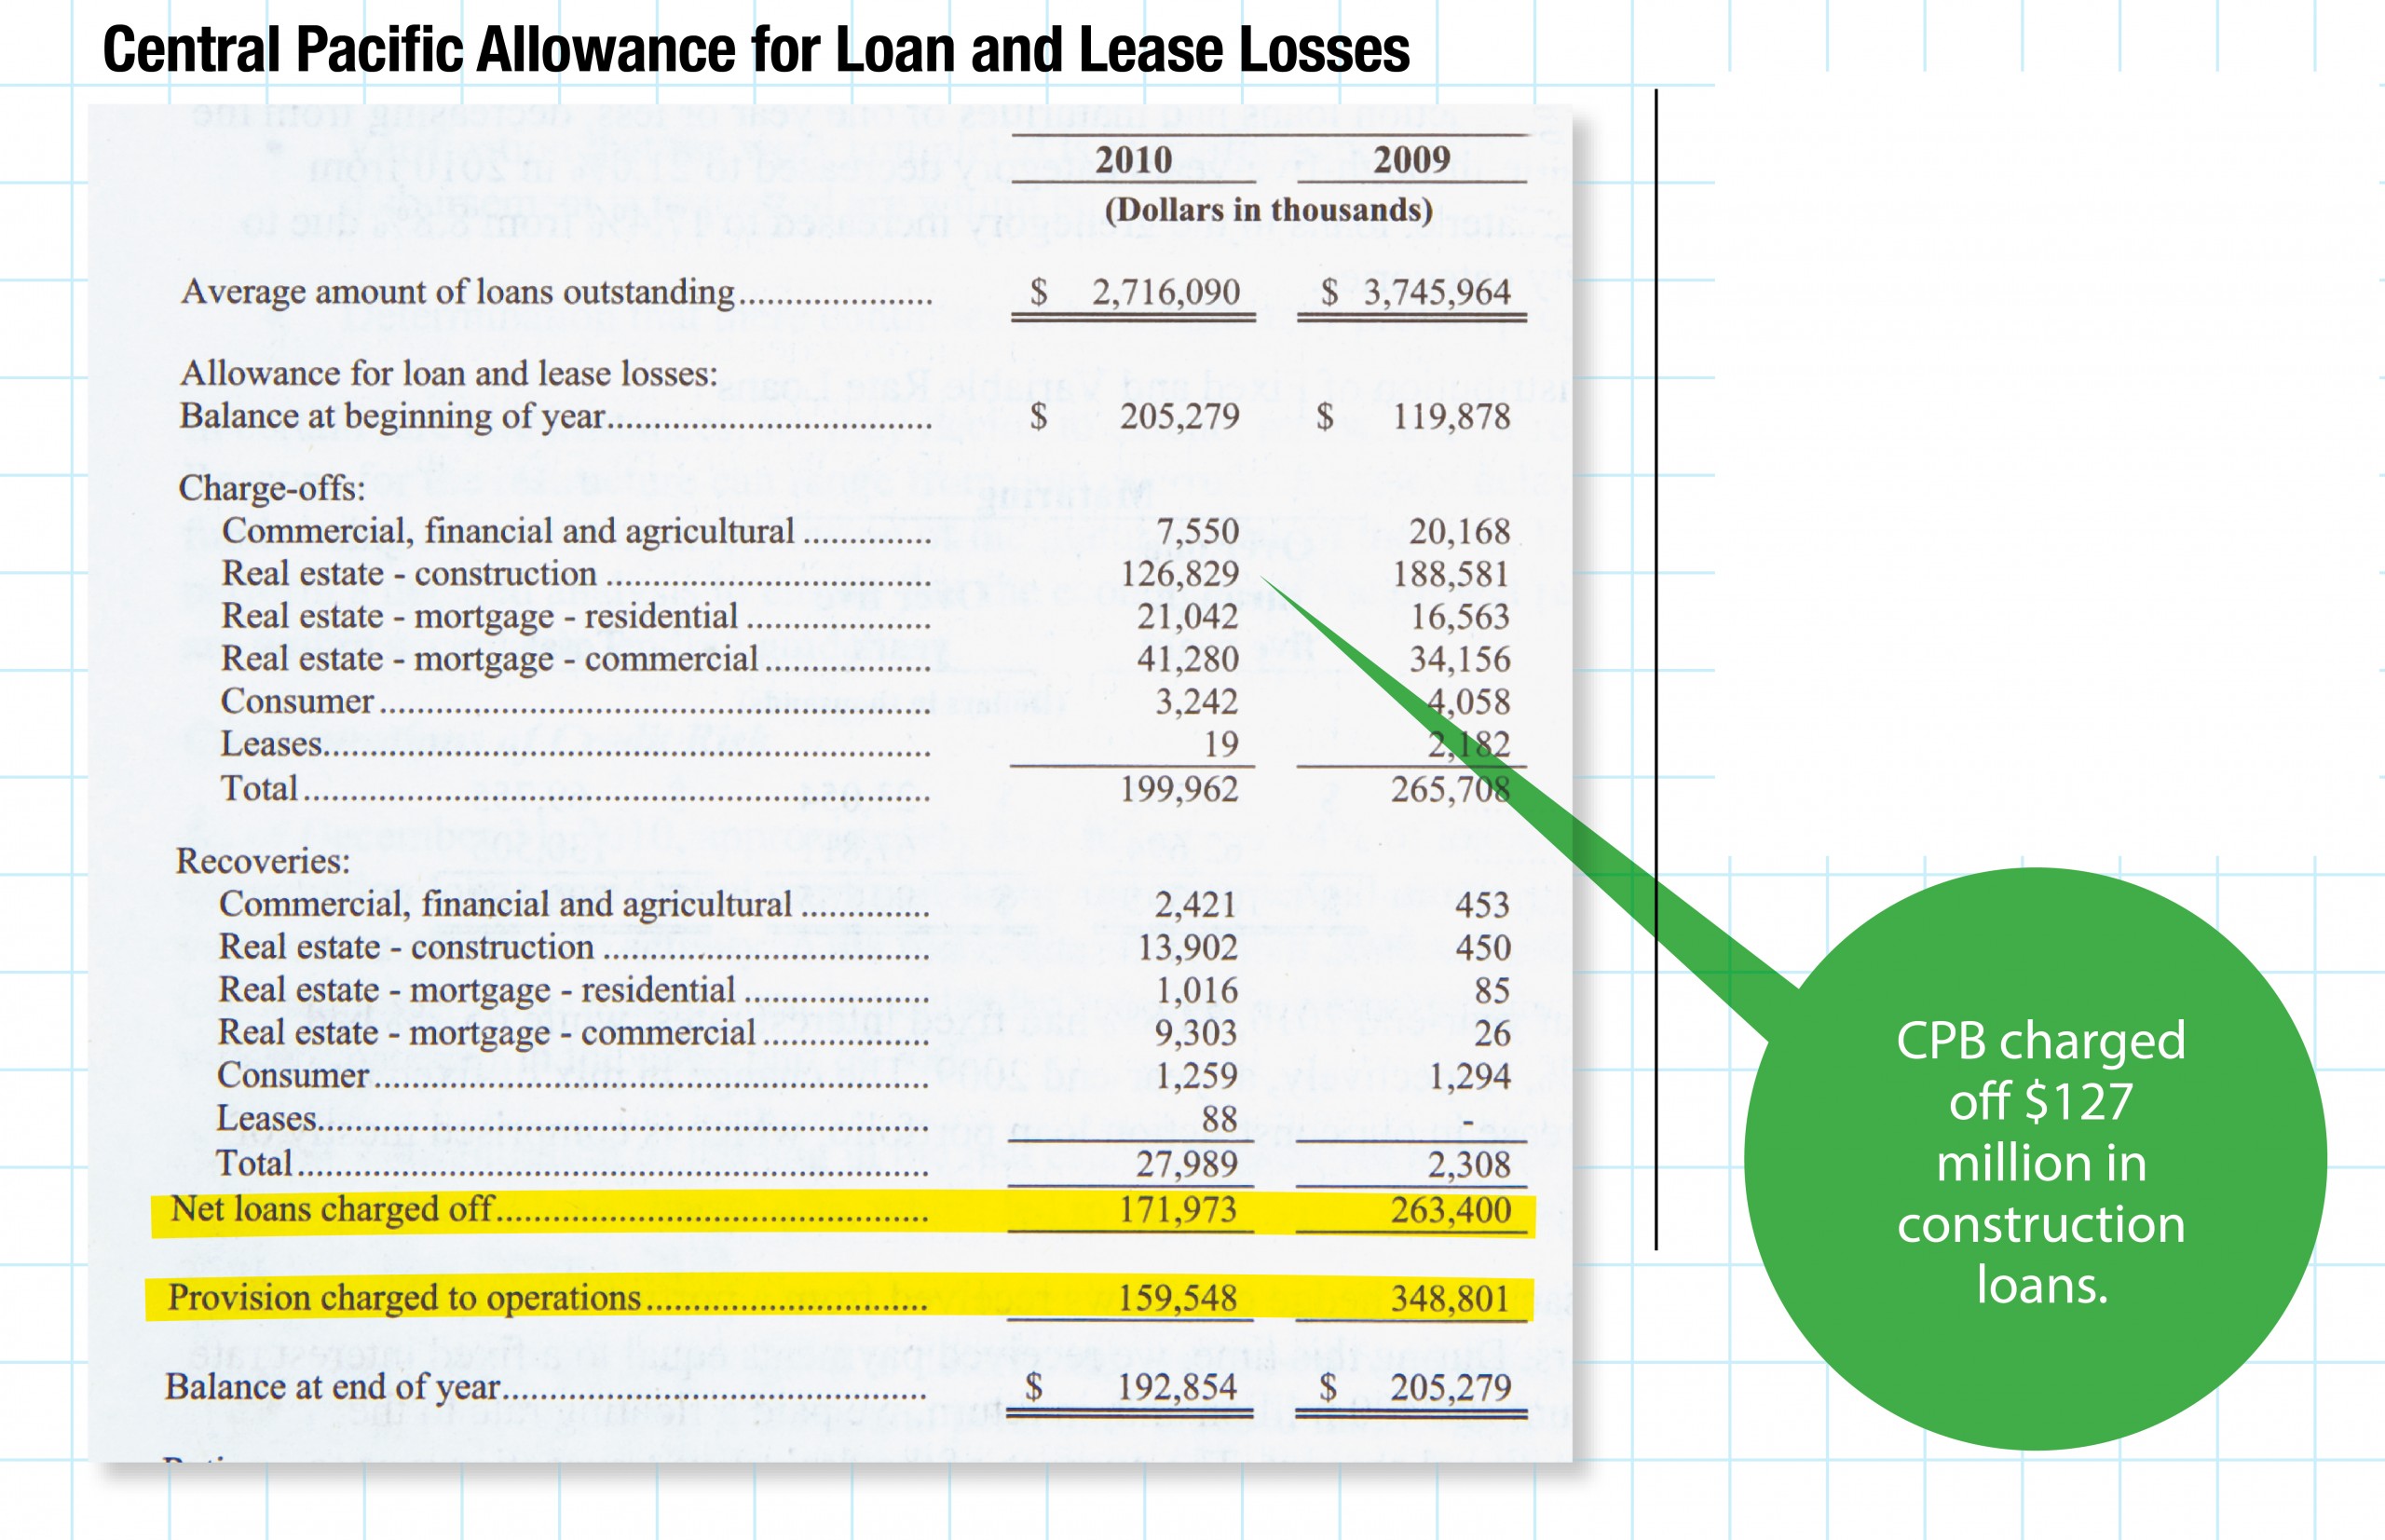
It’s not just the quantity of income, but its quality that counts. “There’s always trade-offs between risk and return,” says Larry Rodriguez, CFO of troubled Central Pacific Bank. “To the extent that somebody wants to take outsized risk, there’s the prospect of high returns. But that return might be short-lived.” For banks, those risks hit the bottom line in an account called the Provision for Future Losses. In 2010, CPB’s income was reduced by a provision of $159 million, which accounted for more than half the bank’s $250 million loss. Because there was no need for a provision in the first quarter of 2011, CPB actually posted a profit.
CREDIT UNIONS
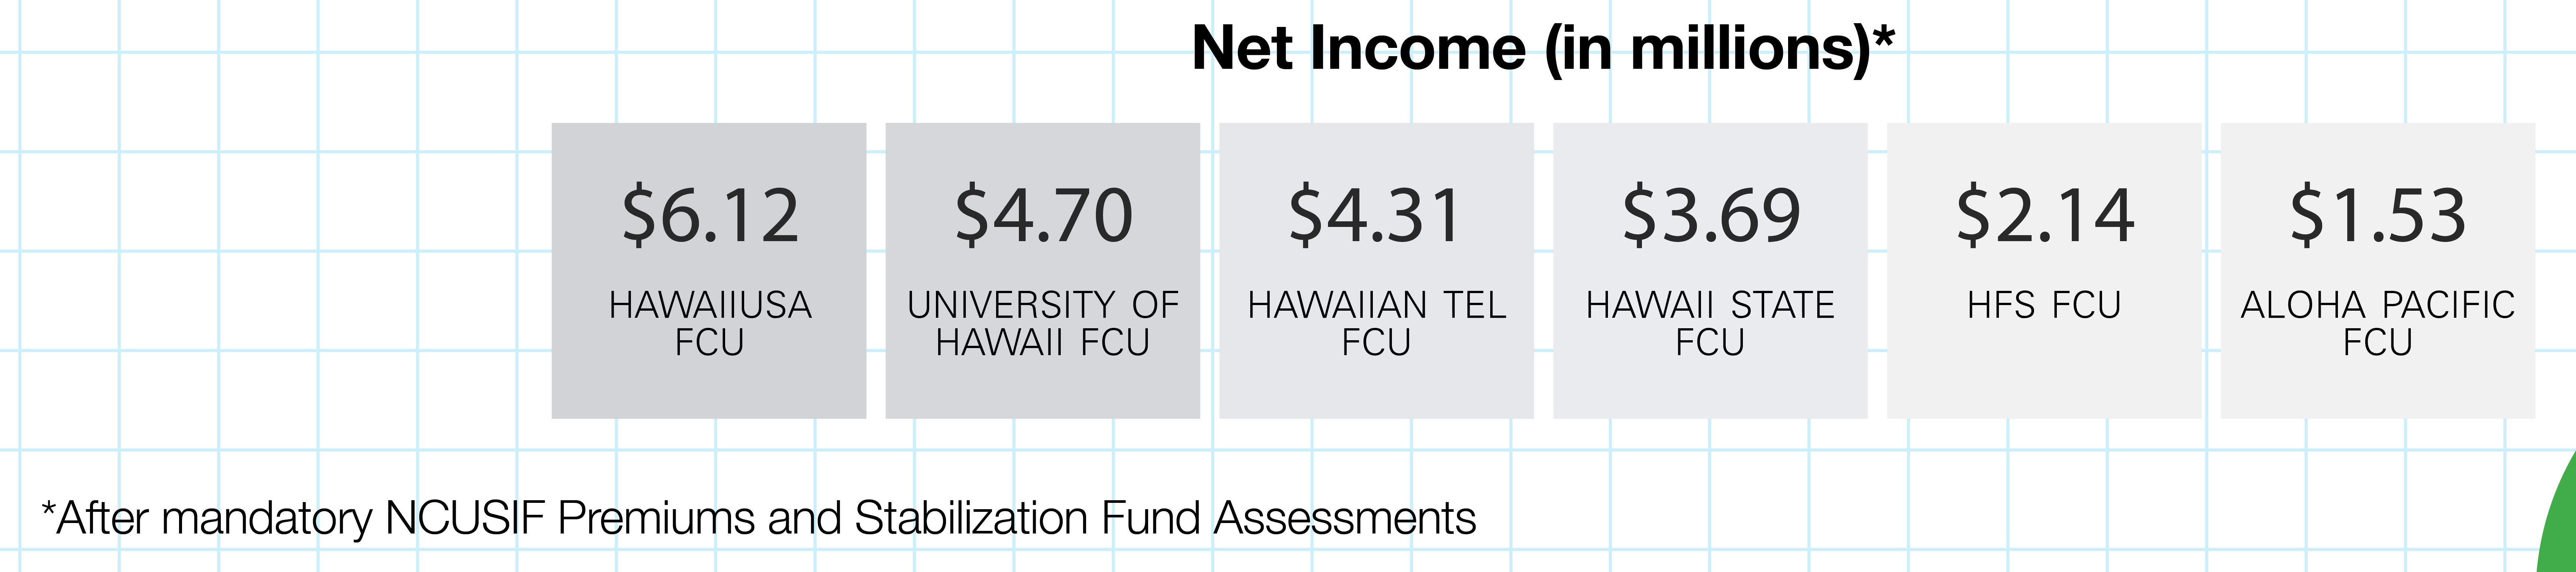
Hawaii’s 5th Most Profitable Bank is a Credit Union
Although credit unions perform many of the same services as banks, there are important differences in how you look at their “profitability” or success.
Like many Top 250 companies, credit unions are nonprofits, but that doesn’t mean they’re unprofitable, says Scott Kaulukukui, executive VP at HawaiiUSA Federal Credit Union. “Because we’re a not-for-profit,” he says, “our returns are supposed to go back to the members. But we still have to make money to survive.”
In fact, if HawaiiUSA were a bank, it would be the fifth most profitable bank in the state.
 Net Worth = Capitalization
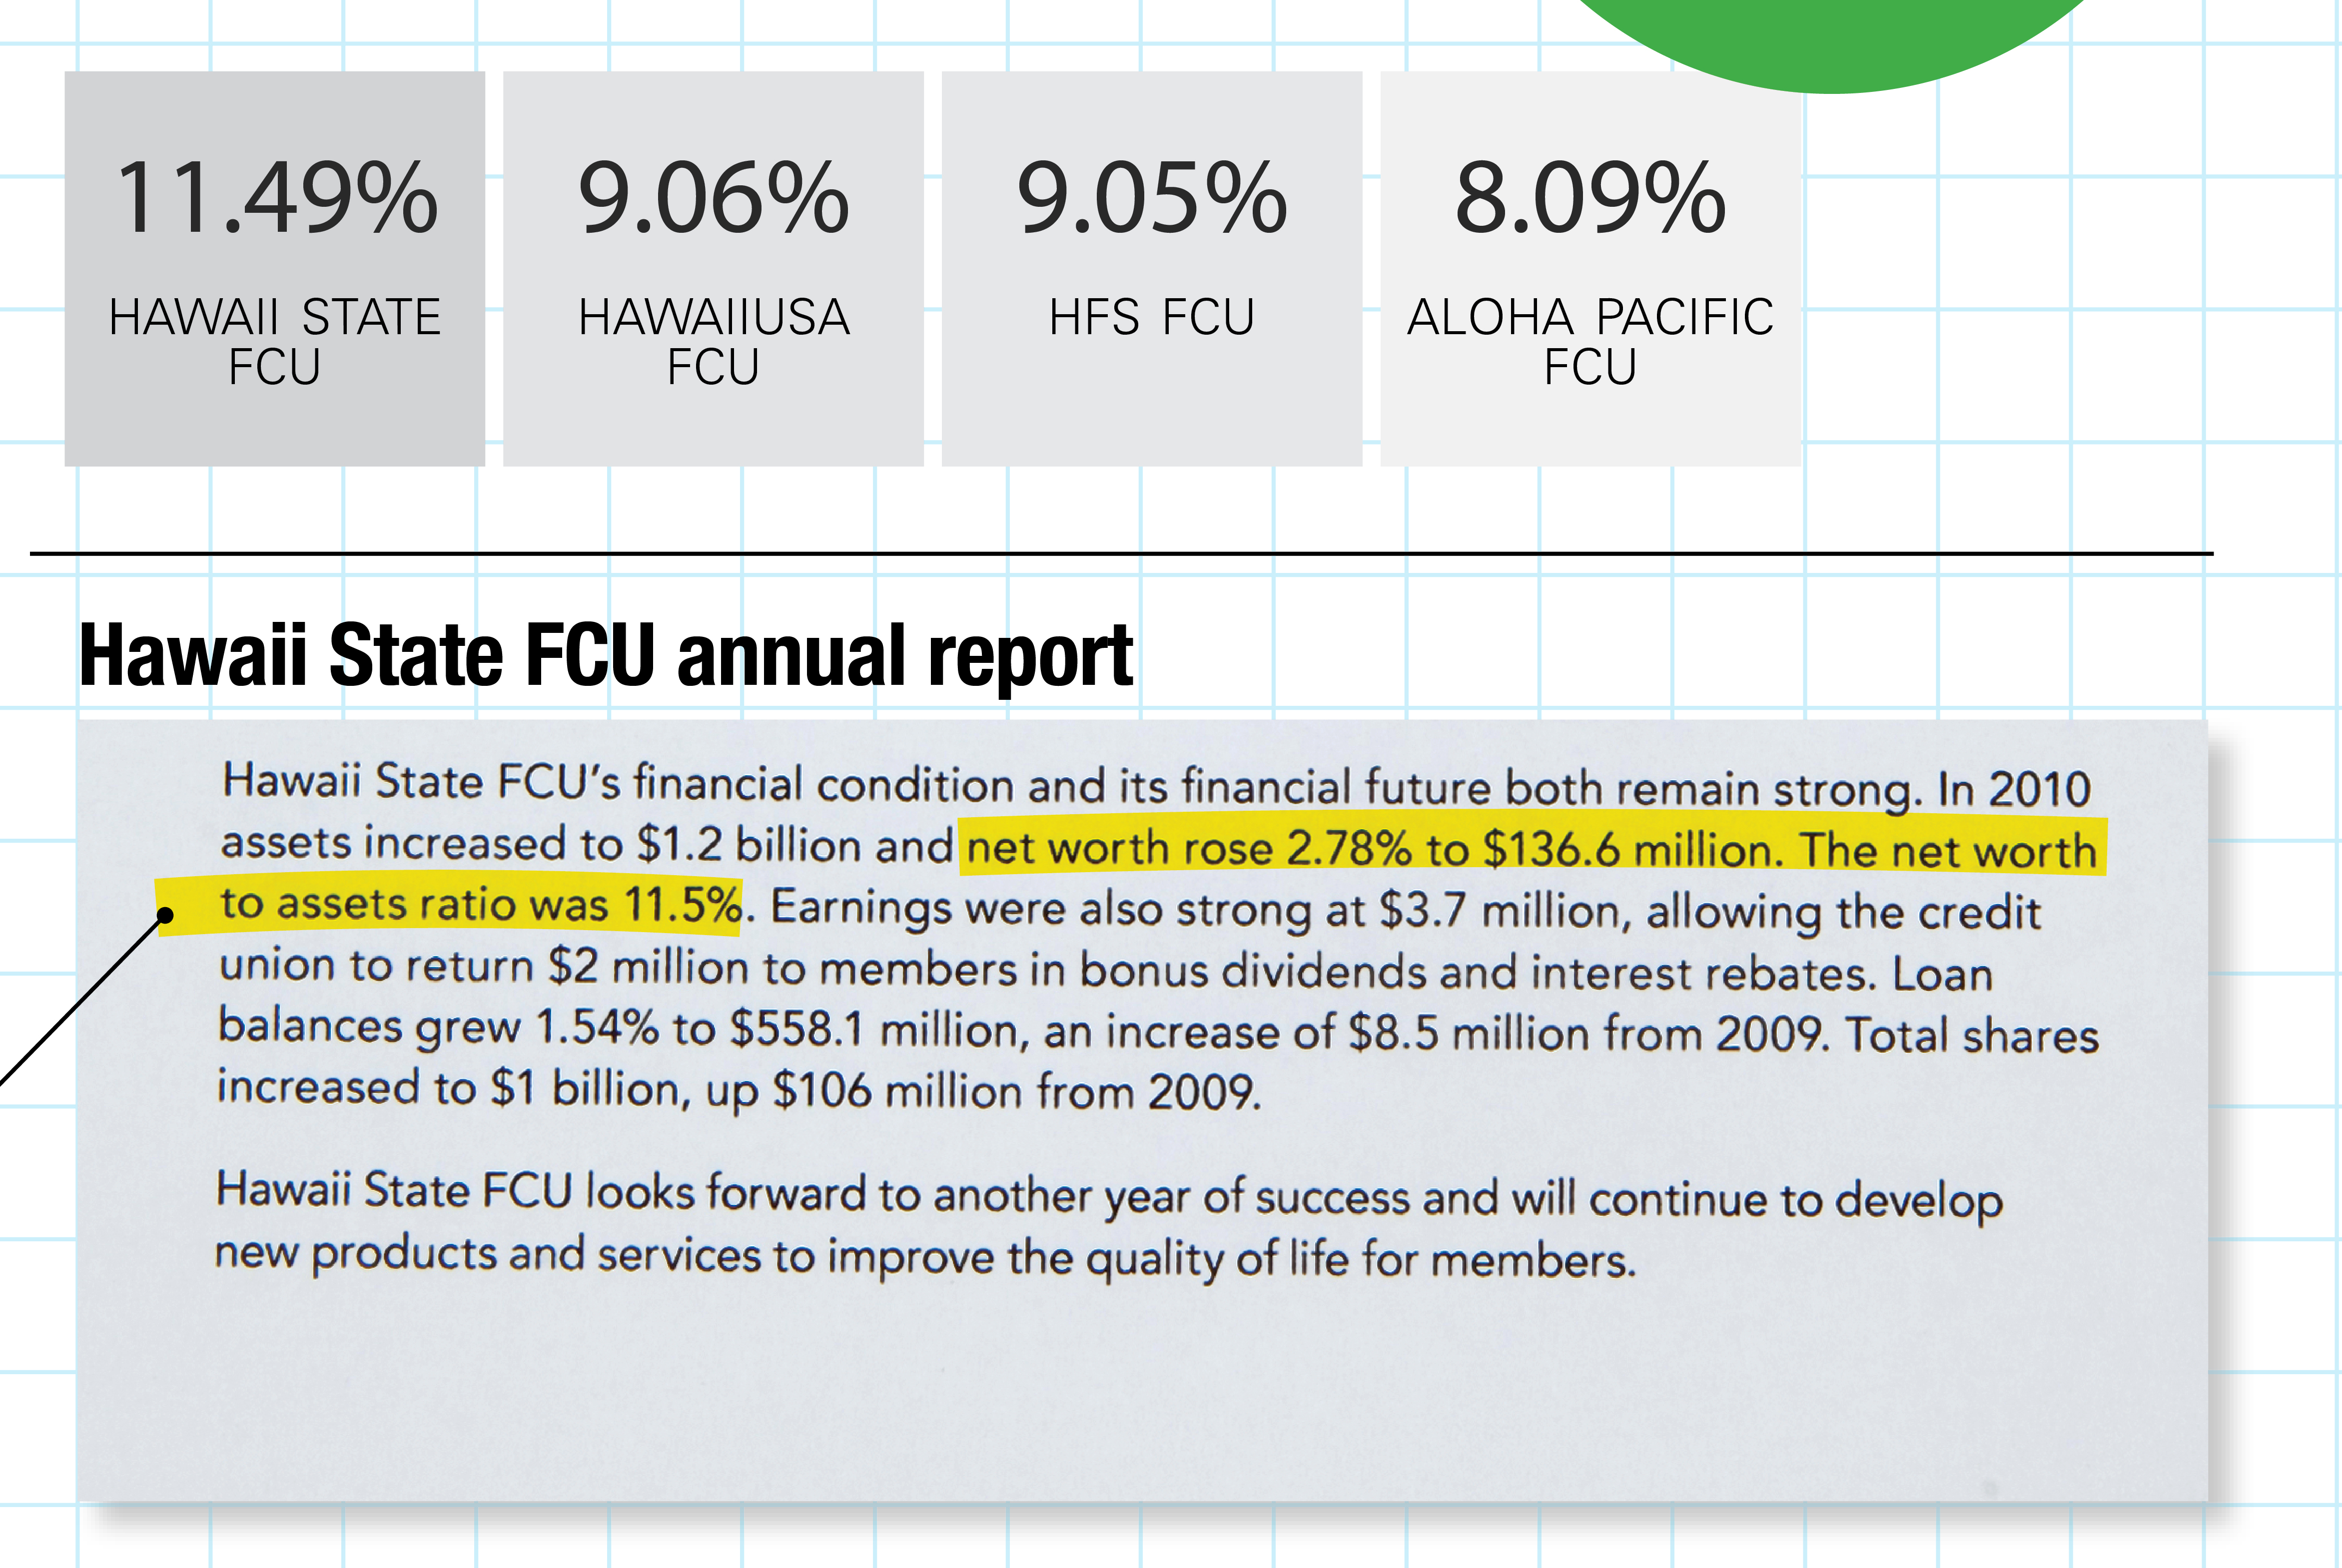
Credit unions are typically more conservative than banks. Where banks are often focused on income ratios, like ROE, credit unions are more interested in capitalization. Maybe the most important figure to a credit union is its net worth. “It’s the same thing as retained earnings from the first day we existed,” says Hawaii USA CFO Greg Chang. “We call it ‘net worth’; but it’s truly capital. It’s our reserve to protect us during losses.” Regulators require a credit union to have a net worth of at least 6 percent of its assets. Hawaii State’s net worth ratio is a robust 11.49 percent. (For comparison, BoH’s ratio would only be 7.7 percent, though the net-worth ratio for First Hawaiian, one of the best-capitalized banks in the country, would be a whopping 17.3 percent.)
Paying Dividends
Of course, the biggest difference between credit unions and banks is that credit unions are owned by members. A quick glance at Hawaii State FCU’s income statement shows that, after paying employees, the single largest expense for a credit union is usually dividends paid to members. Dividends are similar to the interest banks pay to depositors, but they also include the cost of charging lower fees and providing free services to members.
CONGLOMERATES
Biggest Divisions Don’t Always Create Largest Profits
Some of Hawaii’s largest companies are conglomerates with subsidiaries that are big companies in their own right, such as HECO and Matson. To understand the profitability of the conglomerates, you’ve got to look at the pieces.
“At A&B,” notes a local banker, “most of the revenue is in shipping, but most of the profits are in real estate.” That’s because Matson, much like Hawaiian Airlines, simply passes fuel costs along to the consumer without adding to the company’s net income. As a result, operating profits for A&B’s transportation segment were only 7.6 percent of transportation revenues. In its real estate segment, by contrast, the profit margin was a remarkable 31 percent. Below, the red indicates where a division’s proportion of overall profit is much greater than its proportion of revenue.
Less Revenue But Bigger Profits
With conglomerates, some subsidiaries produce a disproportionate share of the profits or revenues.
Advantages
There are advantages to being a conglomerate. For example, offering attractive dividends is crucial for a utility to attract capital. In 2010, HEI was able to pay $93 million in dividends despite only $77 million in profits for its electric utilities.

Accounting Rules
Accounting standards can affect profit. Barnwell uses “full cost accounting” to account for costs on its gas and oil holdings in Canada. That required the company to reduce the book value of these assets in 2009. No cash was involved, but this $26 million expense accounted for most of Barnwell’s net loss that year.
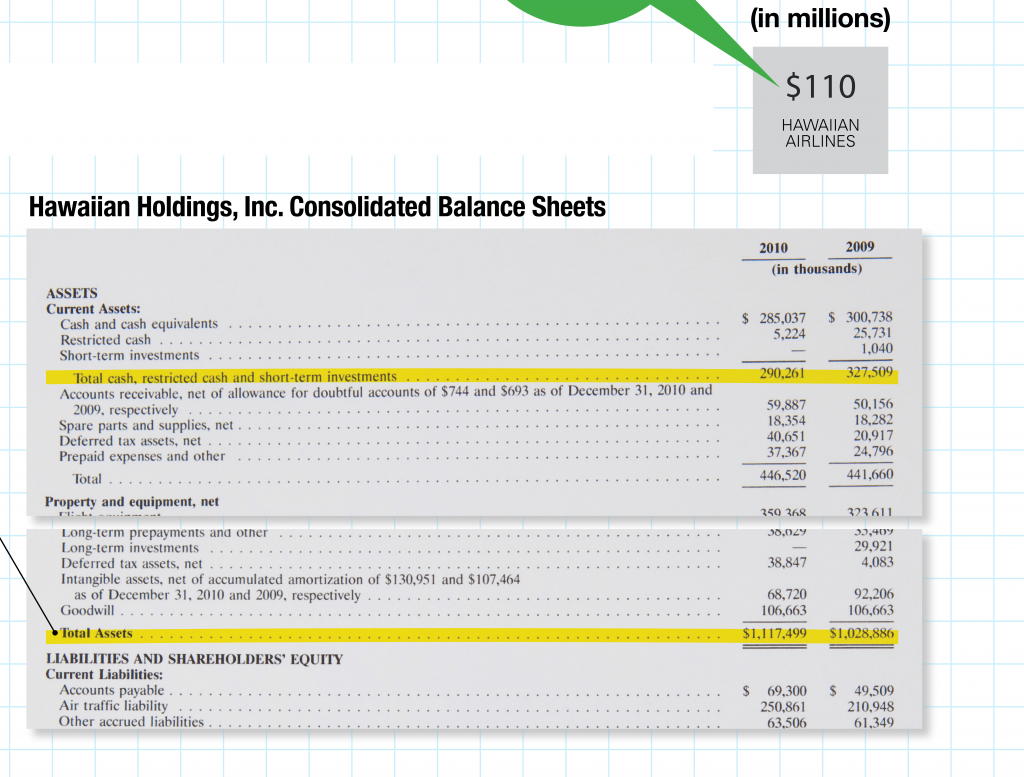
HAWAIIAN AIRLINES
Airline’s Profit Dependent on Volatile Cash Flow
Hawaiian Airlines is a prime example of a cash-flow business. Unlike a bank, which earns interest on vast assets, an airline lives hand to mouth on its earnings. Maybe that’s why cash represents nearly a quarter of Hawaiian Air’s assets (compared to 1.3 percent for Bank of Hawaii). Also, Hawaiian Air had a net income of $110 million, a respectable 9.9 percent ROA – First Hawaiian’s was only 1.58 percent – but, because it depends on cash flow, those profits are more fragile.
Another sign of a cash-flow business: total operating revenue of $1.3 billion exceeded total assets of $1.1 billion. But then, so did $1.2 billion in operating expenses.
 Oil Prices

Airline profits are extremely vulnerable to fuel prices. A one-cent increase in the price of a gallon of aviation fuel costs the company $1.6 million a year. In 2010, Hawaiian spent $323 million in fuel costs, a 32 percent increase from 2009, and 26.5 percent of its operating expenses.

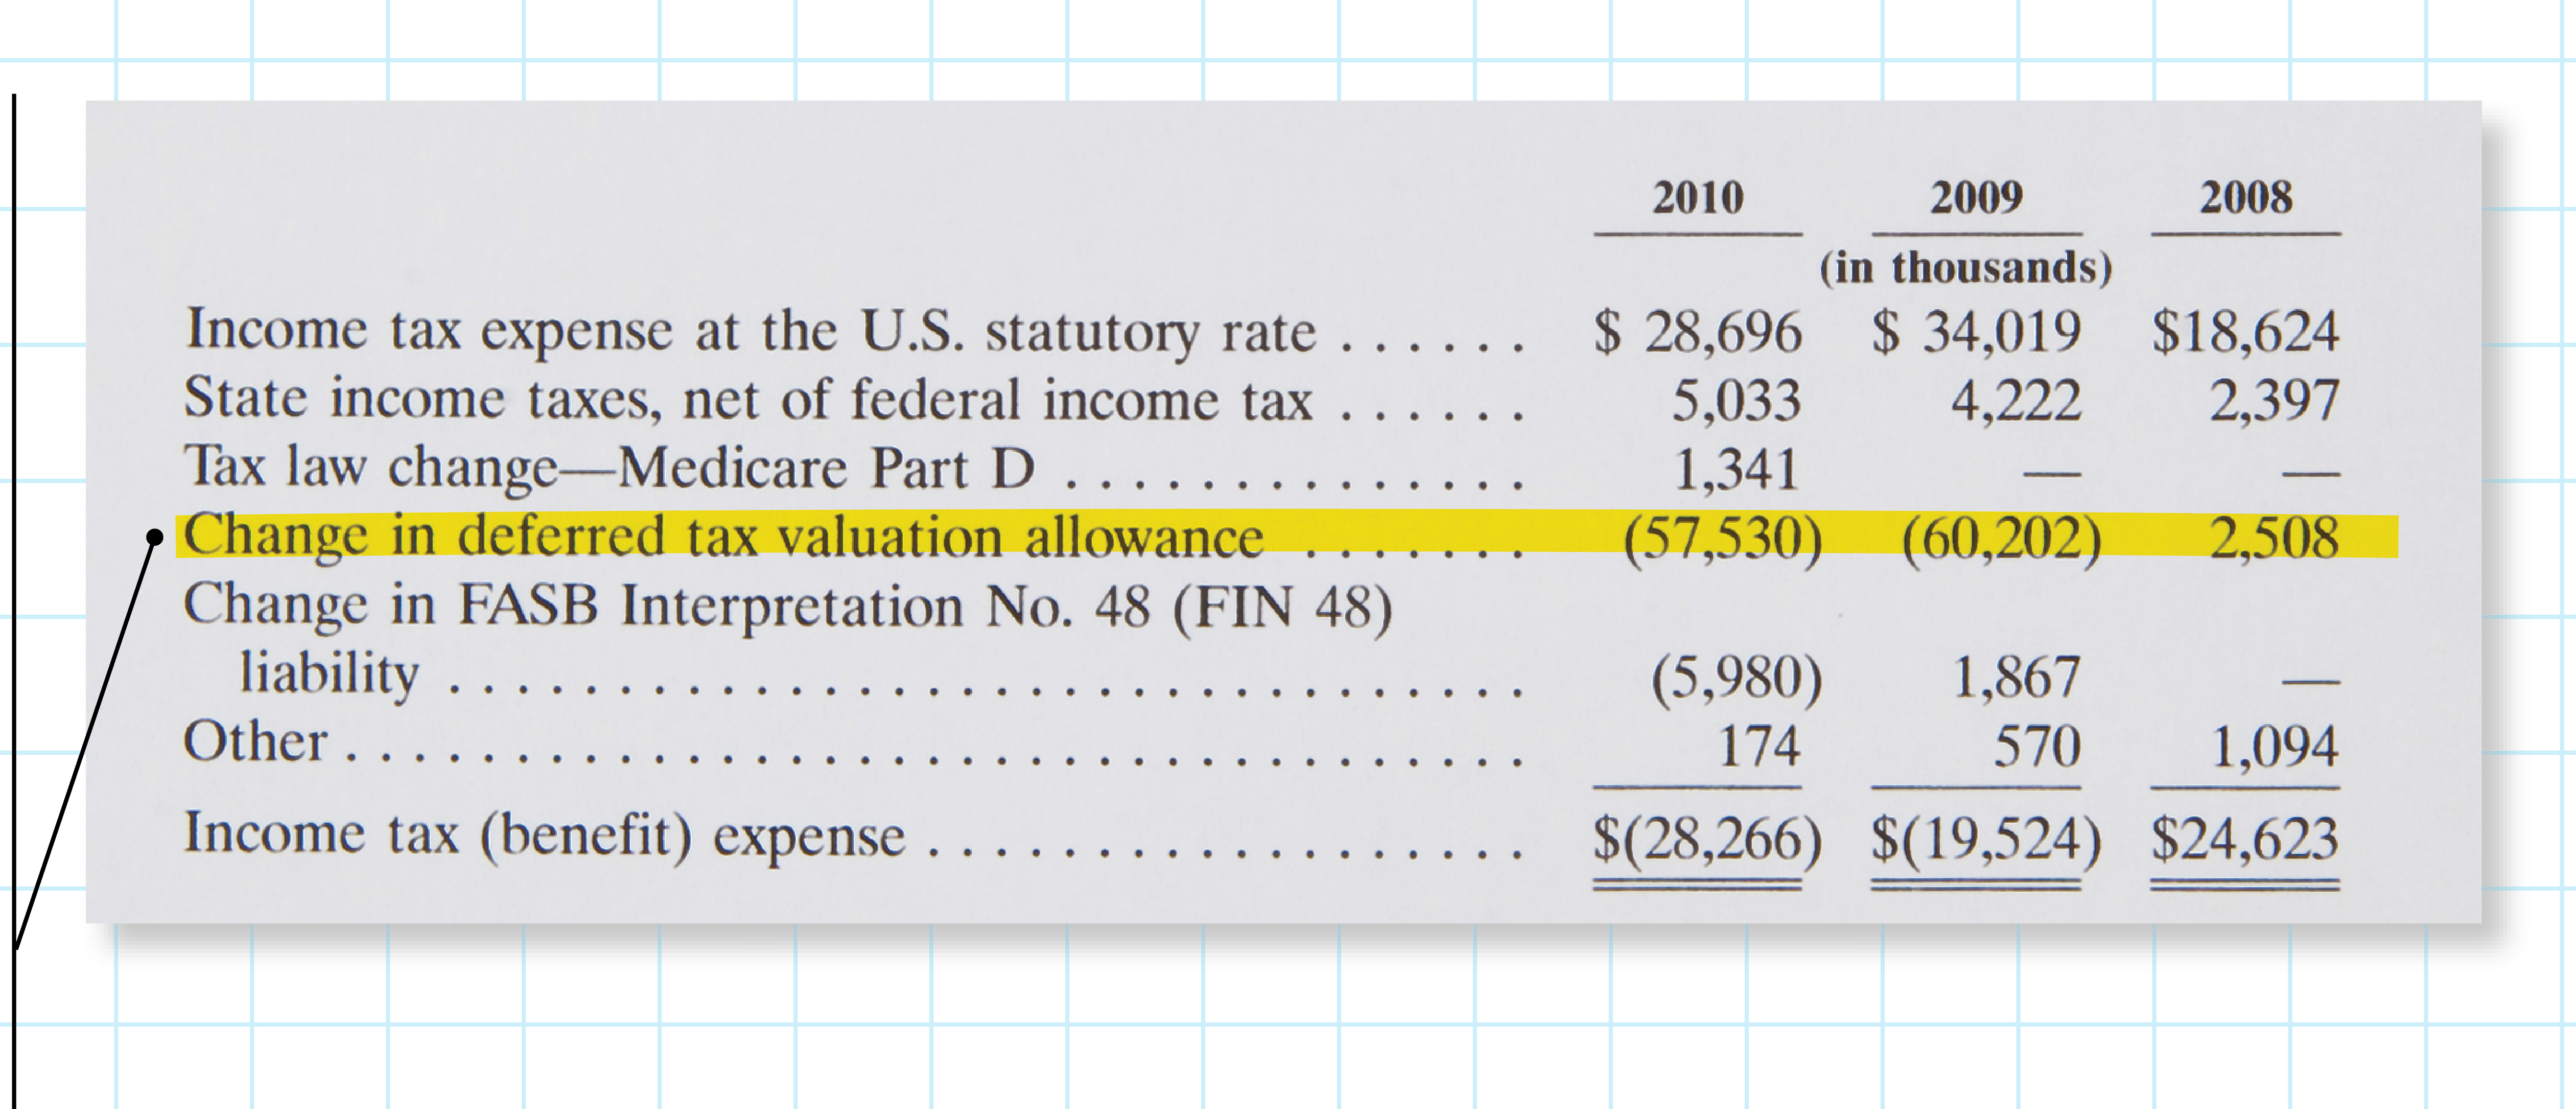
Seeing Profits Differently
When analysts and investors look at a company like Hawaiian, net income isn’t the last word. “We look at profits completely differently,” says Helen Becker, an analyst who covers the airline industry for Dahlman Rose. “We look at profits excluding all non-recurring items.” That makes it easier to compare profits year by year or quarter by quarter. For instance, Becker says, analysts would exclude the 2011 first-quarter losses caused by the earthquake in Japan. Similarly, they might pull out the $57.5 million in deferred tax credits that augmented 2010 profits.
WATER BOARD AND UNIVERSITY OF HAWAII
“Profit” Worth Studying
For government agencies, like nonprofits, it’s complicated to talk about their profitability. On the one hand, we expect them to operate like 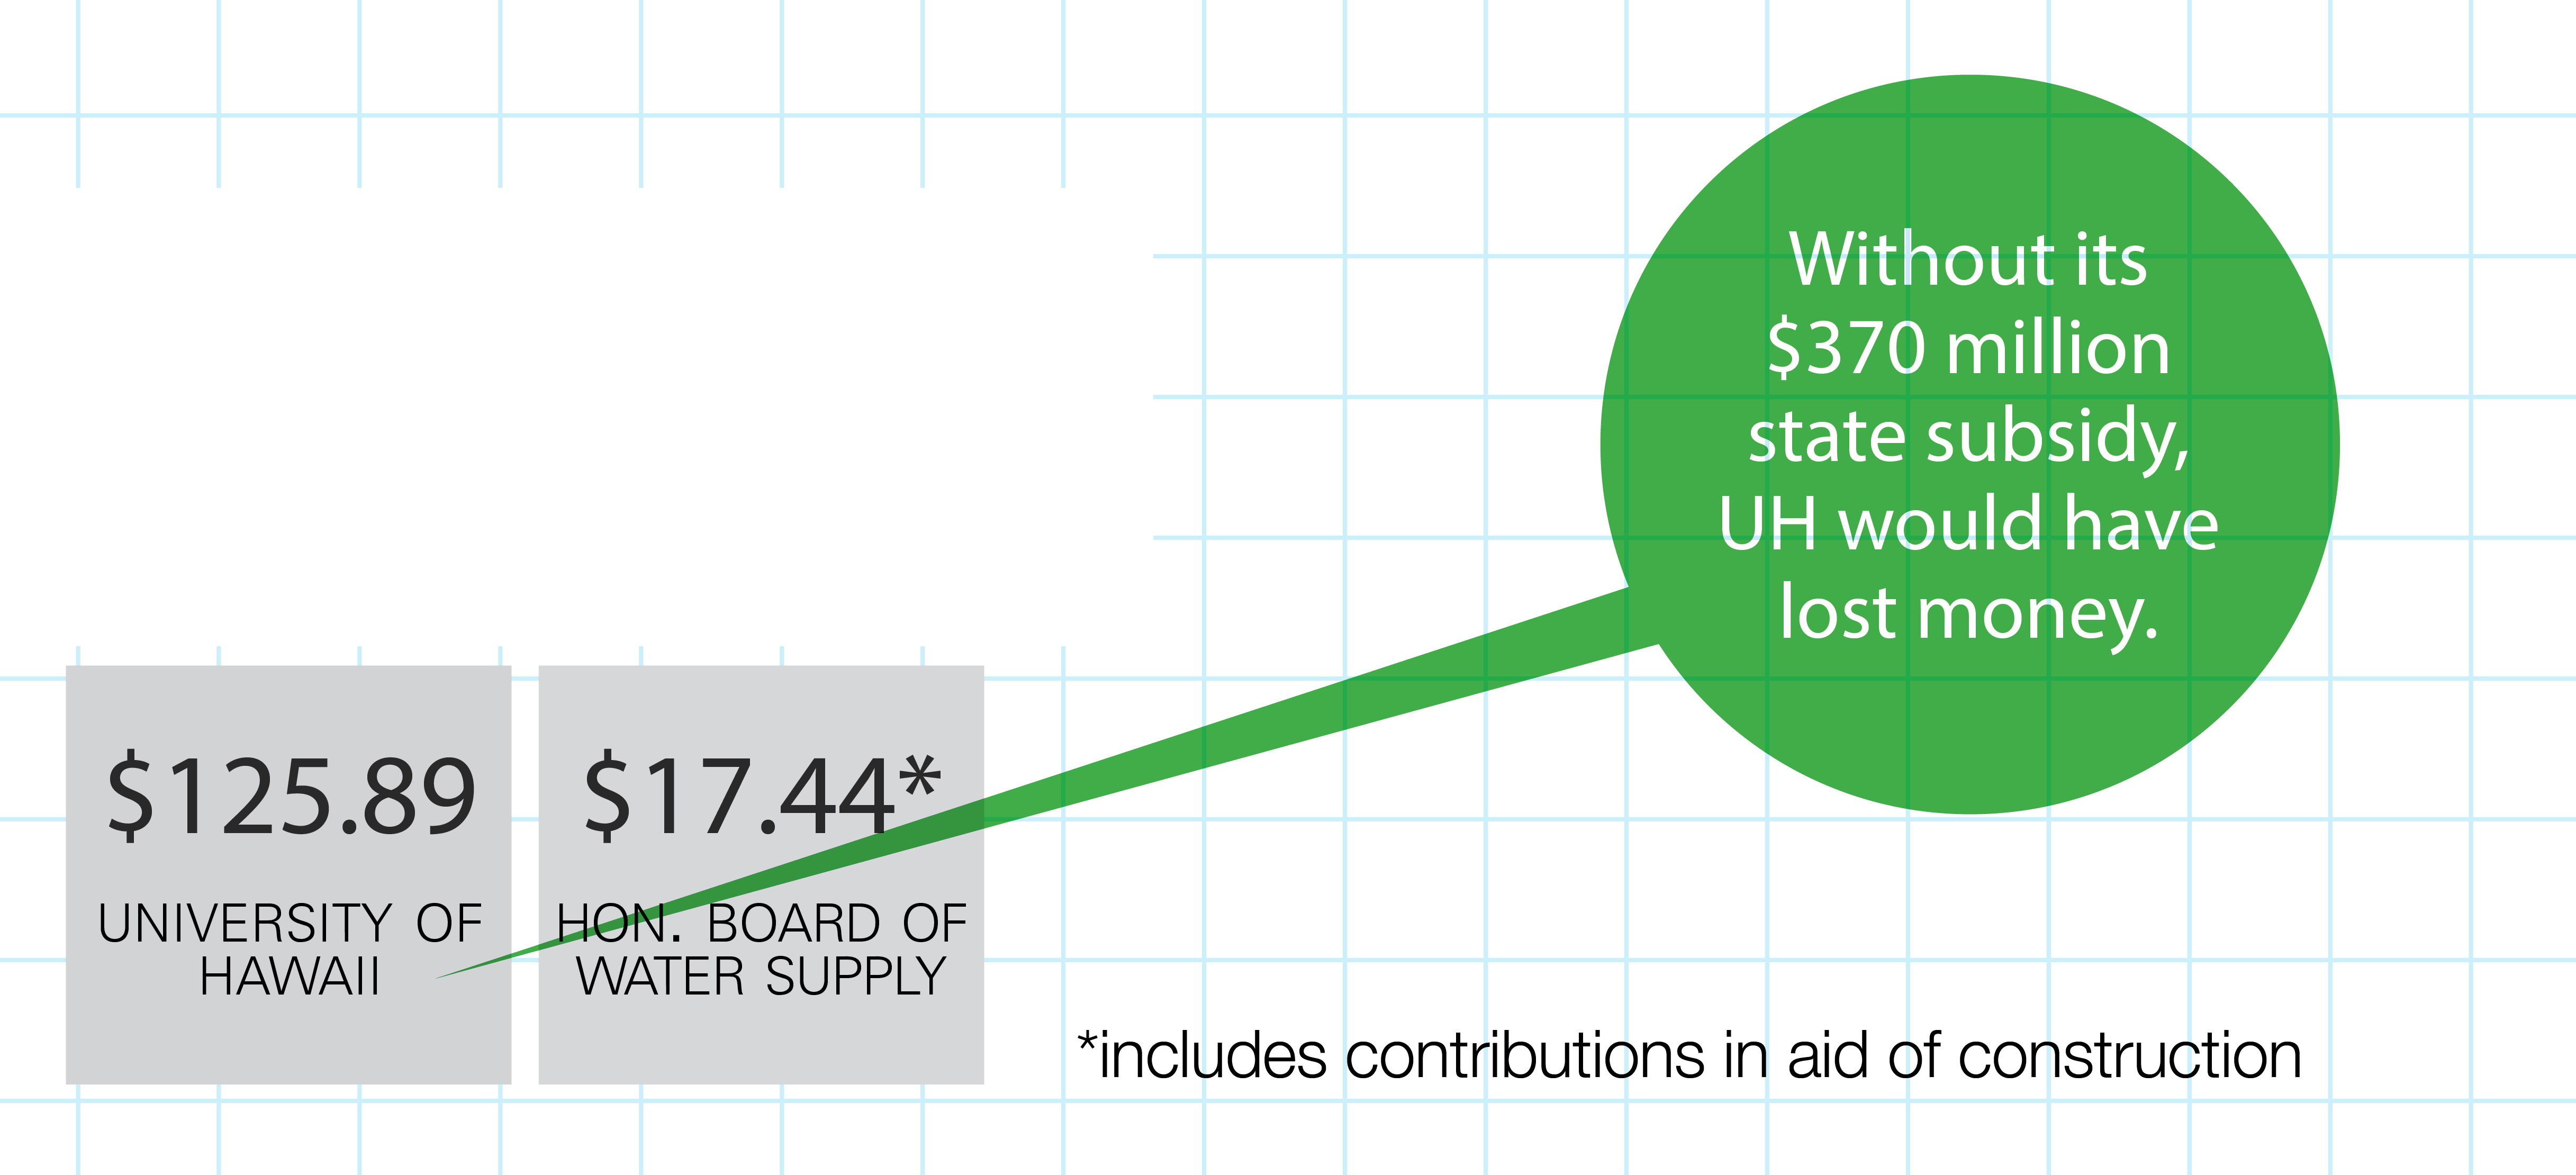 responsible businesses; on the other hand, each has different missions, revenue sources and capital structures. As a consequence, their financial reports present wildly different pictures.
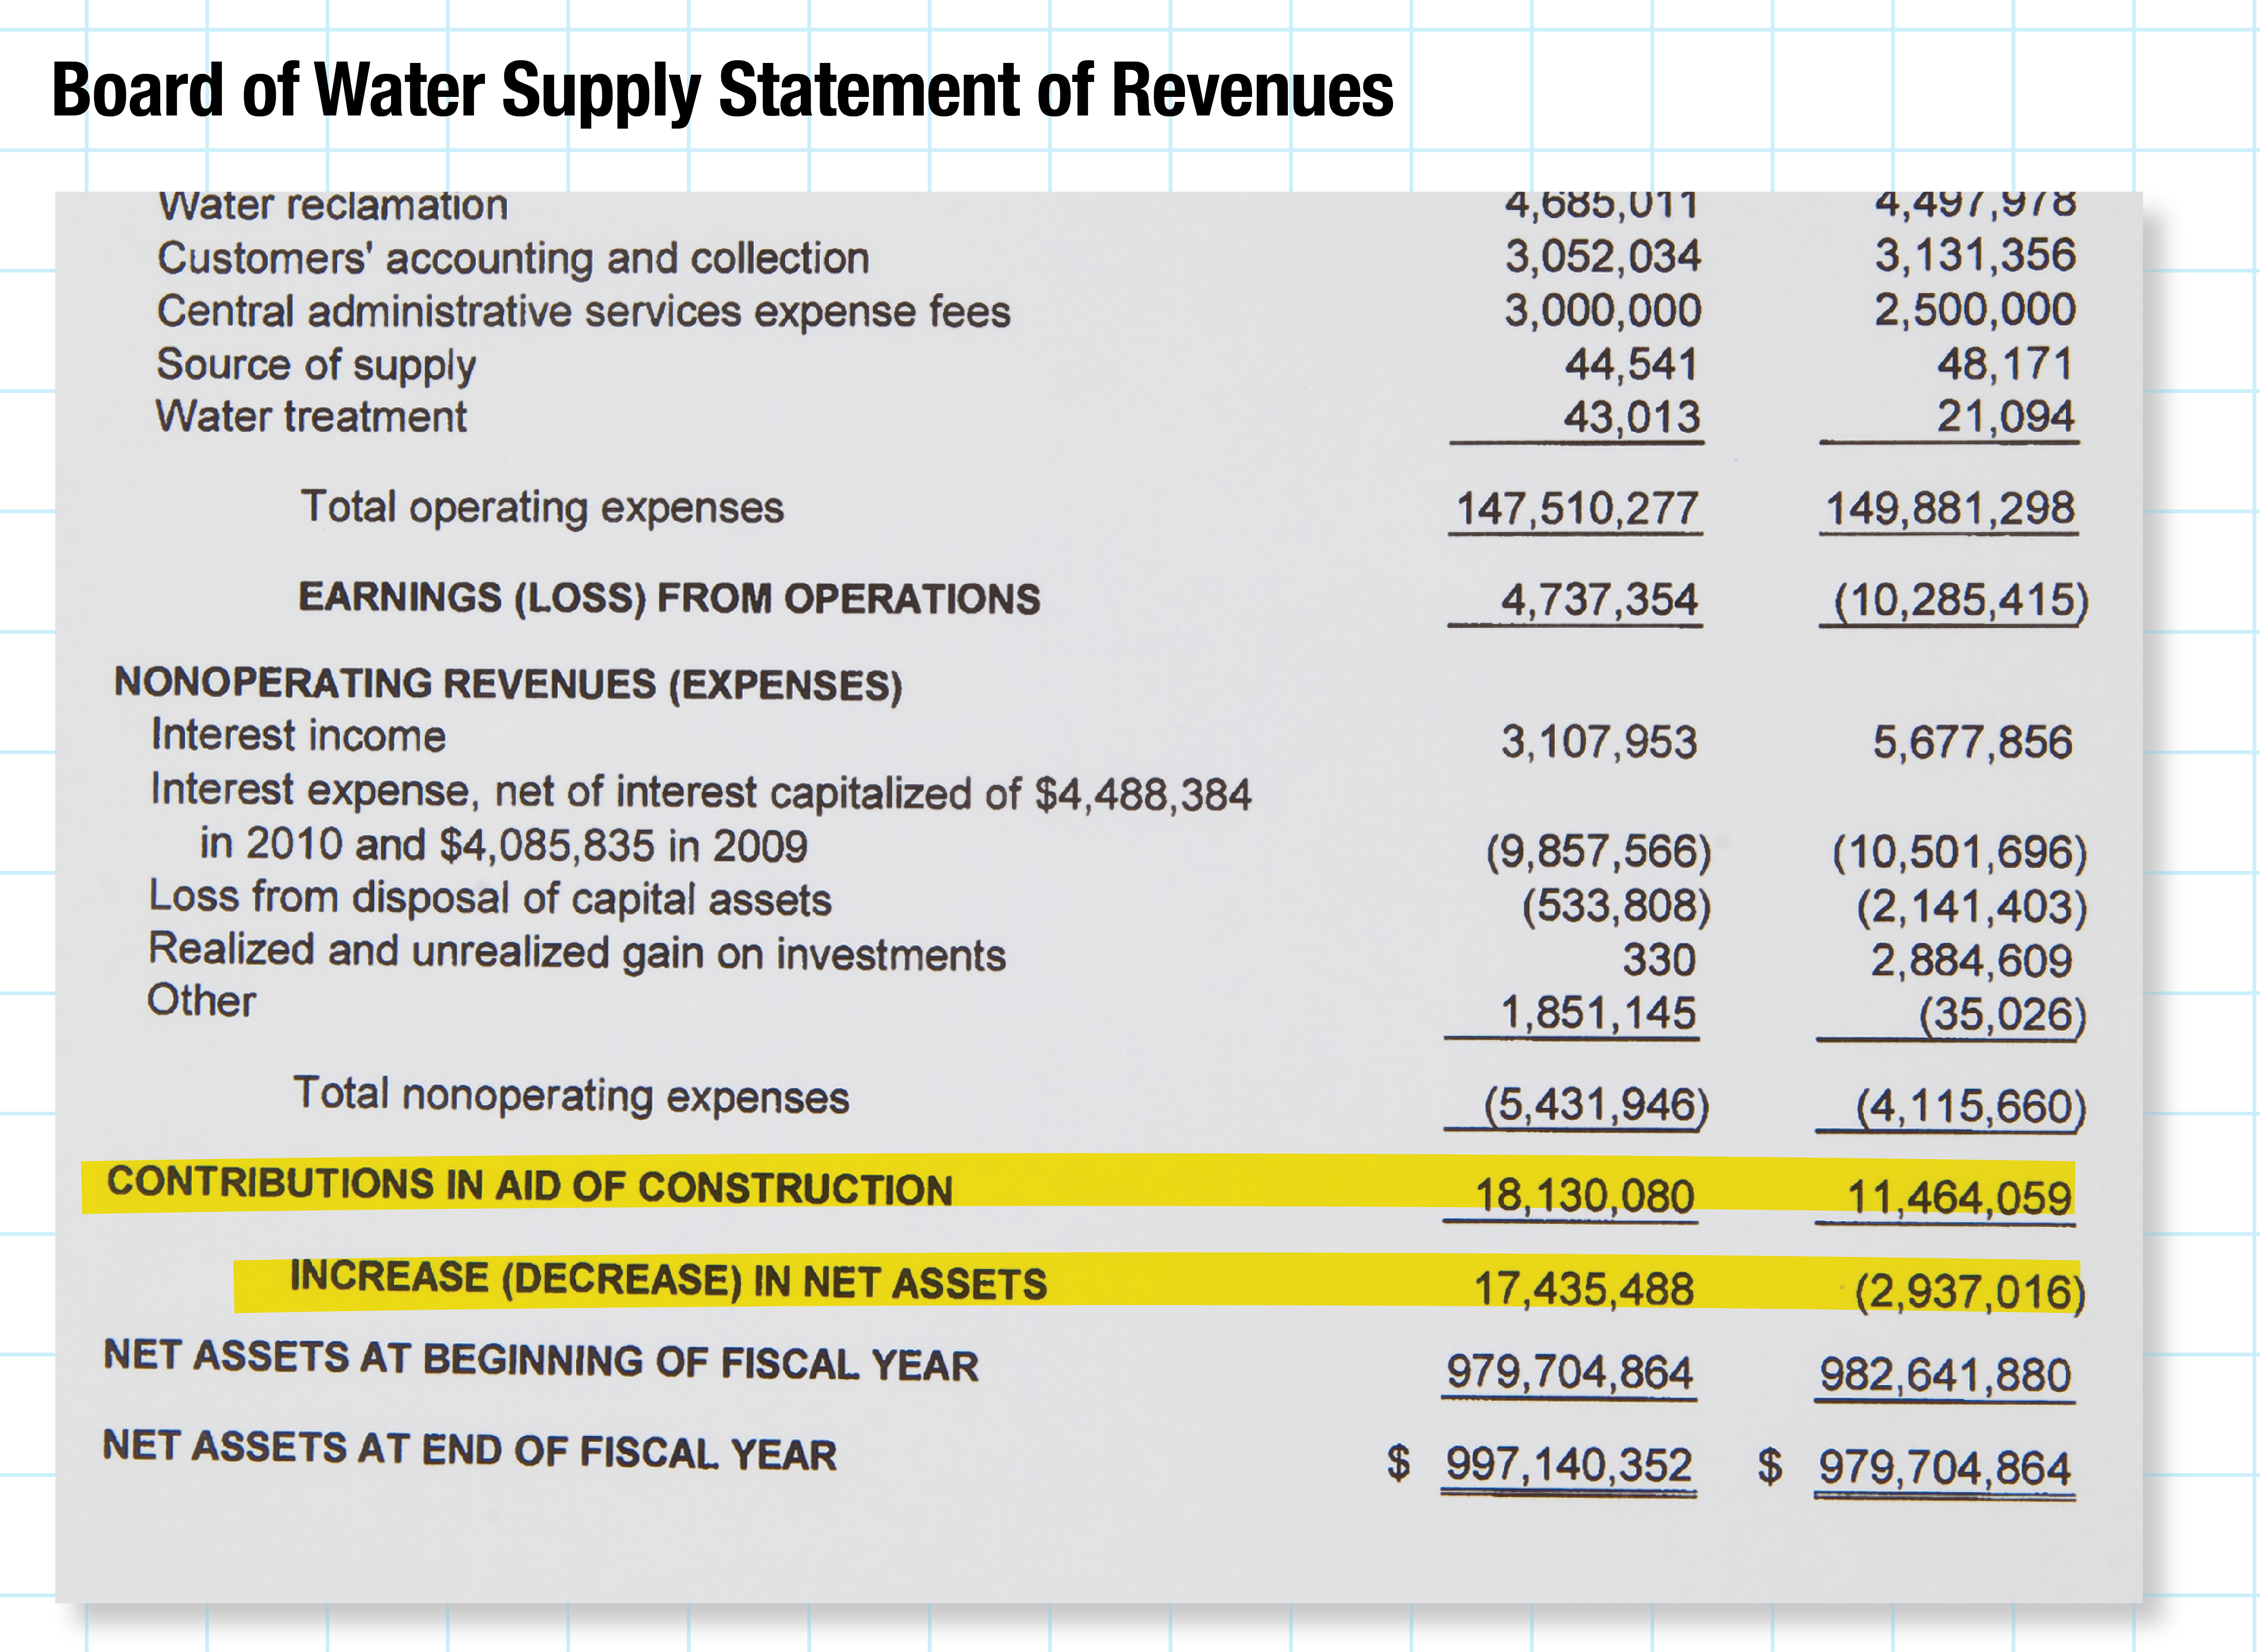
Future Expenses
For example, the numbers in the autonomous Board of Water Supply’s Statements of Revenues, Expenses, and Changes in Net Assets look like those of any other utility. There are some differences, though: Instead of “profits,” BWS reported an “Increase in Net Assets” of $17,435,488 in 2010. That’s an ROA of 1.7 percent – not bad for a utility. That figure, though, includes $18,130,080 in “Contributions in Aid of Construction,” money or property given by developers or government agencies for capital projects. Often, that money must be repaid over time.
Taxpayer Subsidies
By comparison, UH’s income statement is byzantine. UH reported a $125.89 million increase in net assets, but that included $369.95 million in state appropriations (29.9 percent of total revenues) and another $160.97 million in money transferred from other state accounts. Based simply on its own operating revenues, UH lost $404.73 million in 2010.
HAWAIIAN TELCOM
After Bankruptcy, Profits Are Much Easier to Make
Hawaiian Telecom
Hawaiian Telcom, which emerged from Chapter 11 bankruptcy in November 2010, offers the most revealing peek into the complexity of utility profits. That’s because the principles of fresh-start reporting essentially mean we’re talking about two different companies: before and after bankruptcy. Combined, these two companies had a net income of $188.92 million in 2010, but that included $251.67 million in income related to the reorganization.
Different Measures
One of the themes of profitability is that some expenses, like depreciation and amortization, are more like accounting abstractions. They affect a company’s profits, but they’re not actually cash. In capital-intensive sectors, like telecommunications, analysts sometimes look to non-GAAP measures like EBITA – Earnings Before Interest, Taxes and Amortization – to assess a company’s performance. “EBITA can be viewed as a proxy for operational cash flow,” says Hawaiian Telcom CFO Robert Reich. “And the important thing to couple with EBITA is capital expenditures.” In 2010, Hawaiian Telcom invested $78.9 million of its earnings back into the company.
The Future
The real story is about Hawaiian Telcom’s future profitability. Through the process of reorganization and fresh-start reporting, the company was able to devalue its assets by $452 million in 2010. Similarly, liabilities were reduced by $881 million and equity increased by $425 million. That means both future depreciation expenses and future interest expenses will decline dramatically. The result: net profits.

HEALTH CARE
Hospitals Hurt by Patients (and Governments) who Don’t Pay
Queen’s operating income of $30.80 million was 4.6 percent of its 2010 revenues. That’s a tight operating margin – little more than two weeks of cash flow. And as Queen’s CFO Rick Keene puts it, “Cash is king.”
The problem in health care, Keene says, is that “so many of your costs are beyond your control.” That may not show up on the front of a 990, but, buried in the schedules in the back, the story is clear. Queen’s Schedule H, for example, shows $60 million in expenses for unpaid charity care, unreimbursed Medicare services and other community benefits. In other words, the cost of its free services was twice its “profit.”
One-Time Costs for HPH

Sometimes, the picture of a company’s balance sheet can be blurred by one-time costs. In 2010, for example, Hawaii Pacific Health paid off $234 million in long-term debt, which took a $132 million bite out of the company’s assets, but also reduced its liabilities by $163 million.
Obligations postponed, like accrued pension liabilities, are often a sign that today’s “profits” have been bought with tomorrow’s dollars.
Hawaii Health Systems is Hardest Hit
Government-run hospitals have it even worse; that’s why the HHSC runs the largest deficit. The state had to appropriate $67 million in 2009 to augment HHSC revenues and another $25 million for an employee pay raise. Even so, HHSC had a $62 million decrease in assets, leaving it with an accumulated deficit of $114 million in what passes for equity in a government agency. At right, see its 2009 statement of revenues.
INSURANCE COMPANIES
Investments Help Create Profits
Output vs. Input
“ For the most part,” says Island Insurance CFO Noland Kawano, “we look at something called the combined ratio. Basically, this is a measure of how much you’re paying out vs. how much you’re receiving.” Although complicated to calculate, the combined ratio is easy to understand. “If you have a combined ratio of 97, that means for every dollar you take in, you pay out 97 cents.” Obviously, the lower the combined ratio, the better the profit.
Investments
Insurance companies don’t just make money selling insurance, they also earn interest on investments. In fact, insurance companies can be profitable even when they’ve lost money in underwriting. For example, in 2010, HEMIC had a net income of $8.7 million despite an underwriting loss of $669,128.

Can’t Reserve Losses
Where other industries make provisions for expected losses in their income statements, tax law forbids the practice in catastrophe insurance. “We’re actually not allowed to reserve for those losses until they occur,” says Island Insurance’s Kawano. “Let’s say I exclusively wrote hurricane insurance. My losses are always going to be zero until something happens. So I’m always going to be profitable until the wind blows.”
HEALTH INSURANCE COMPANIES
Banking Profits in Case of Hard Times Ahead
All of Hawaii’s major health insurance companies are nonprofit organizations, so net income isn’t the only measure of their success. But, as HMSA CFO Steve van Ribbink puts it, “No margin, no mission.”
However, those margins can be slim to nonexistent. Over the past five years, for example, HMSA has lost about $100 million. Of course, compared to over $8 billion in dues, that’s only a loss of about 1.2 percent.
Big is Relative
Since there are no shareholders, health insurance companies plow any profits back into the company’s surplus. That surplus, which a for-profit would call equity, is like savings against hard times. In 2010, HMSA, the giant of Hawaii health insurers, had a surplus of $389 million. “That’s what we have accumulated over 70 plus years of existence,” van Ribbink says. Although it seems like a lot of money, he points out it would only cover about two and a half months of expenses.
NONPROFIT ORGANIZATIONS
No Margin, No Mission
To fulfill their missions in the long term, nonprofits have to make money (including a small profit), but profitability isn’t the best measure of their success. It might be more instructive to look at how well they manage their expenses. For example, administration costs accounted for only about 10 percent of Hawaii Community Foundation’s expenses. The rest is invested in the community.
Frequently, much of a nonprofit’s revenue is restricted for specific purposes. Thirty-five percent of HCF’s net revenue was unavailable for program spending.
Investing in the Future
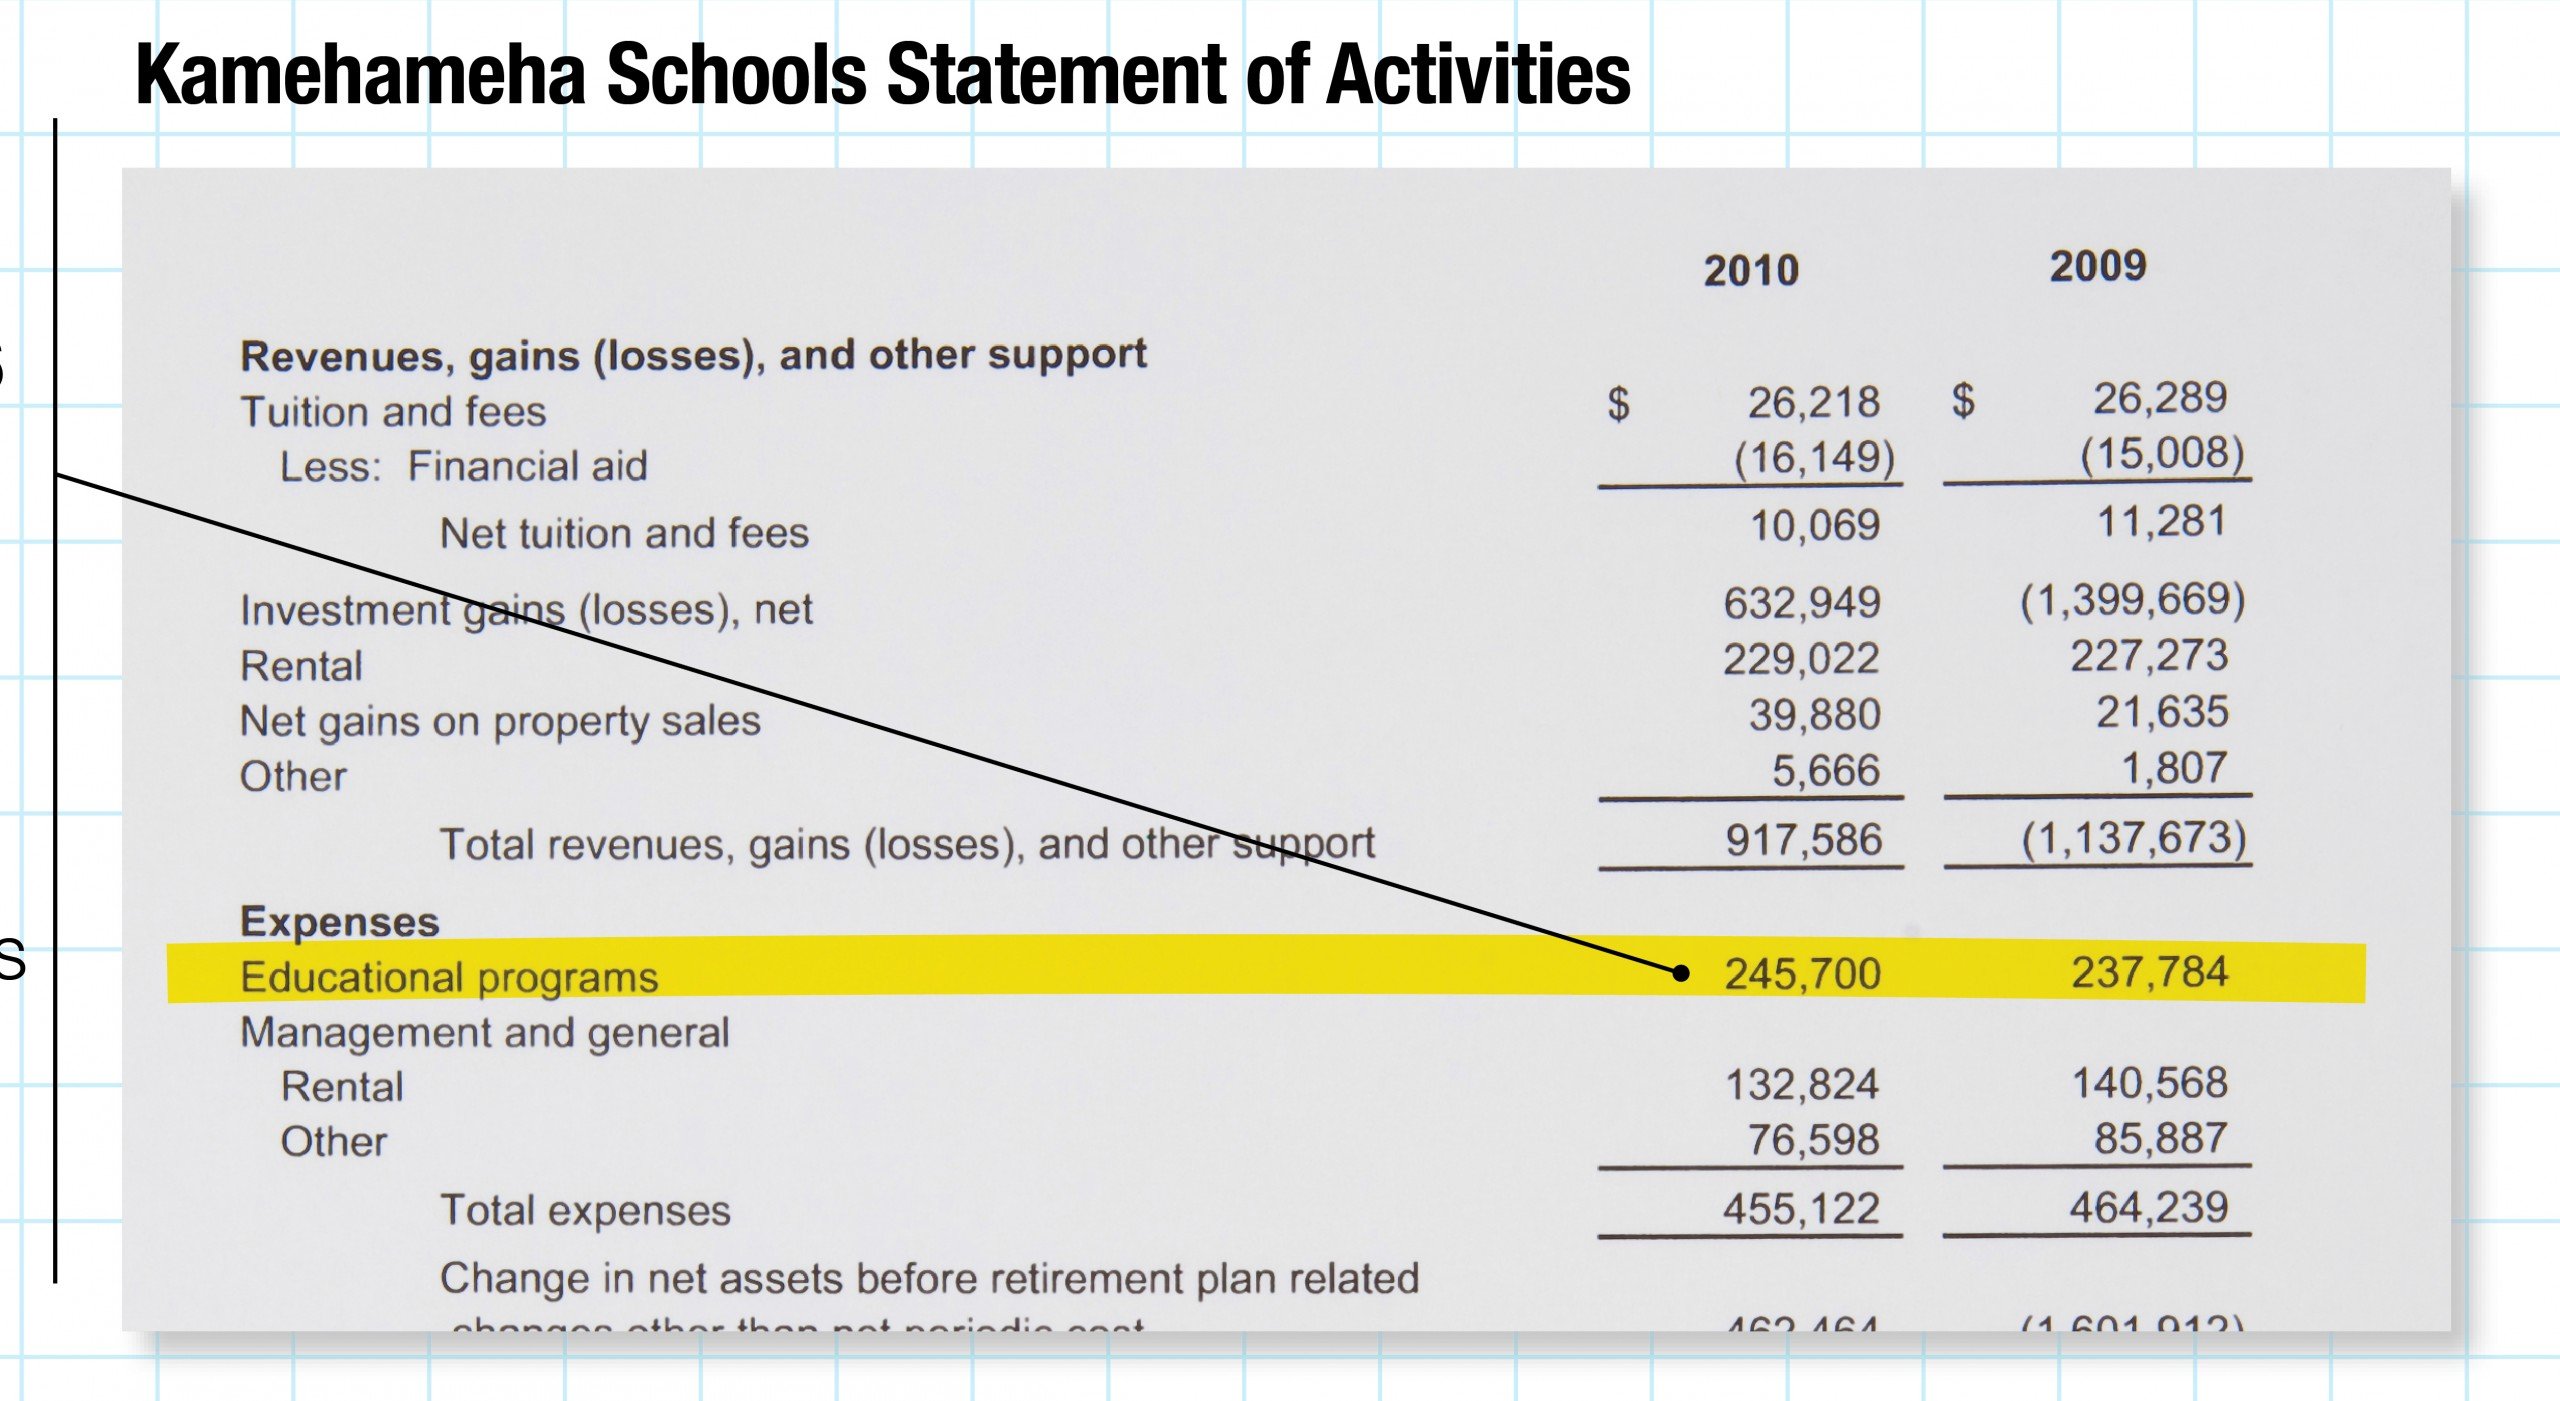
Nonprofit trusts and foundations are also subject to GAAP rules that can overstate revenues. Although Kamehameha Schools posted investment gains of $633 million in 2010, half of that was an accounting illusion, the result of mark-to-market rules. Even so, Kamehameha Schools spent an astonishing $246 million on education in 2010.
Sometimes unspent revenue rankles stakeholders, but a nonprofit has to invest in its future if it wants to sustain its mission. Remember: “No margin, no mission.”
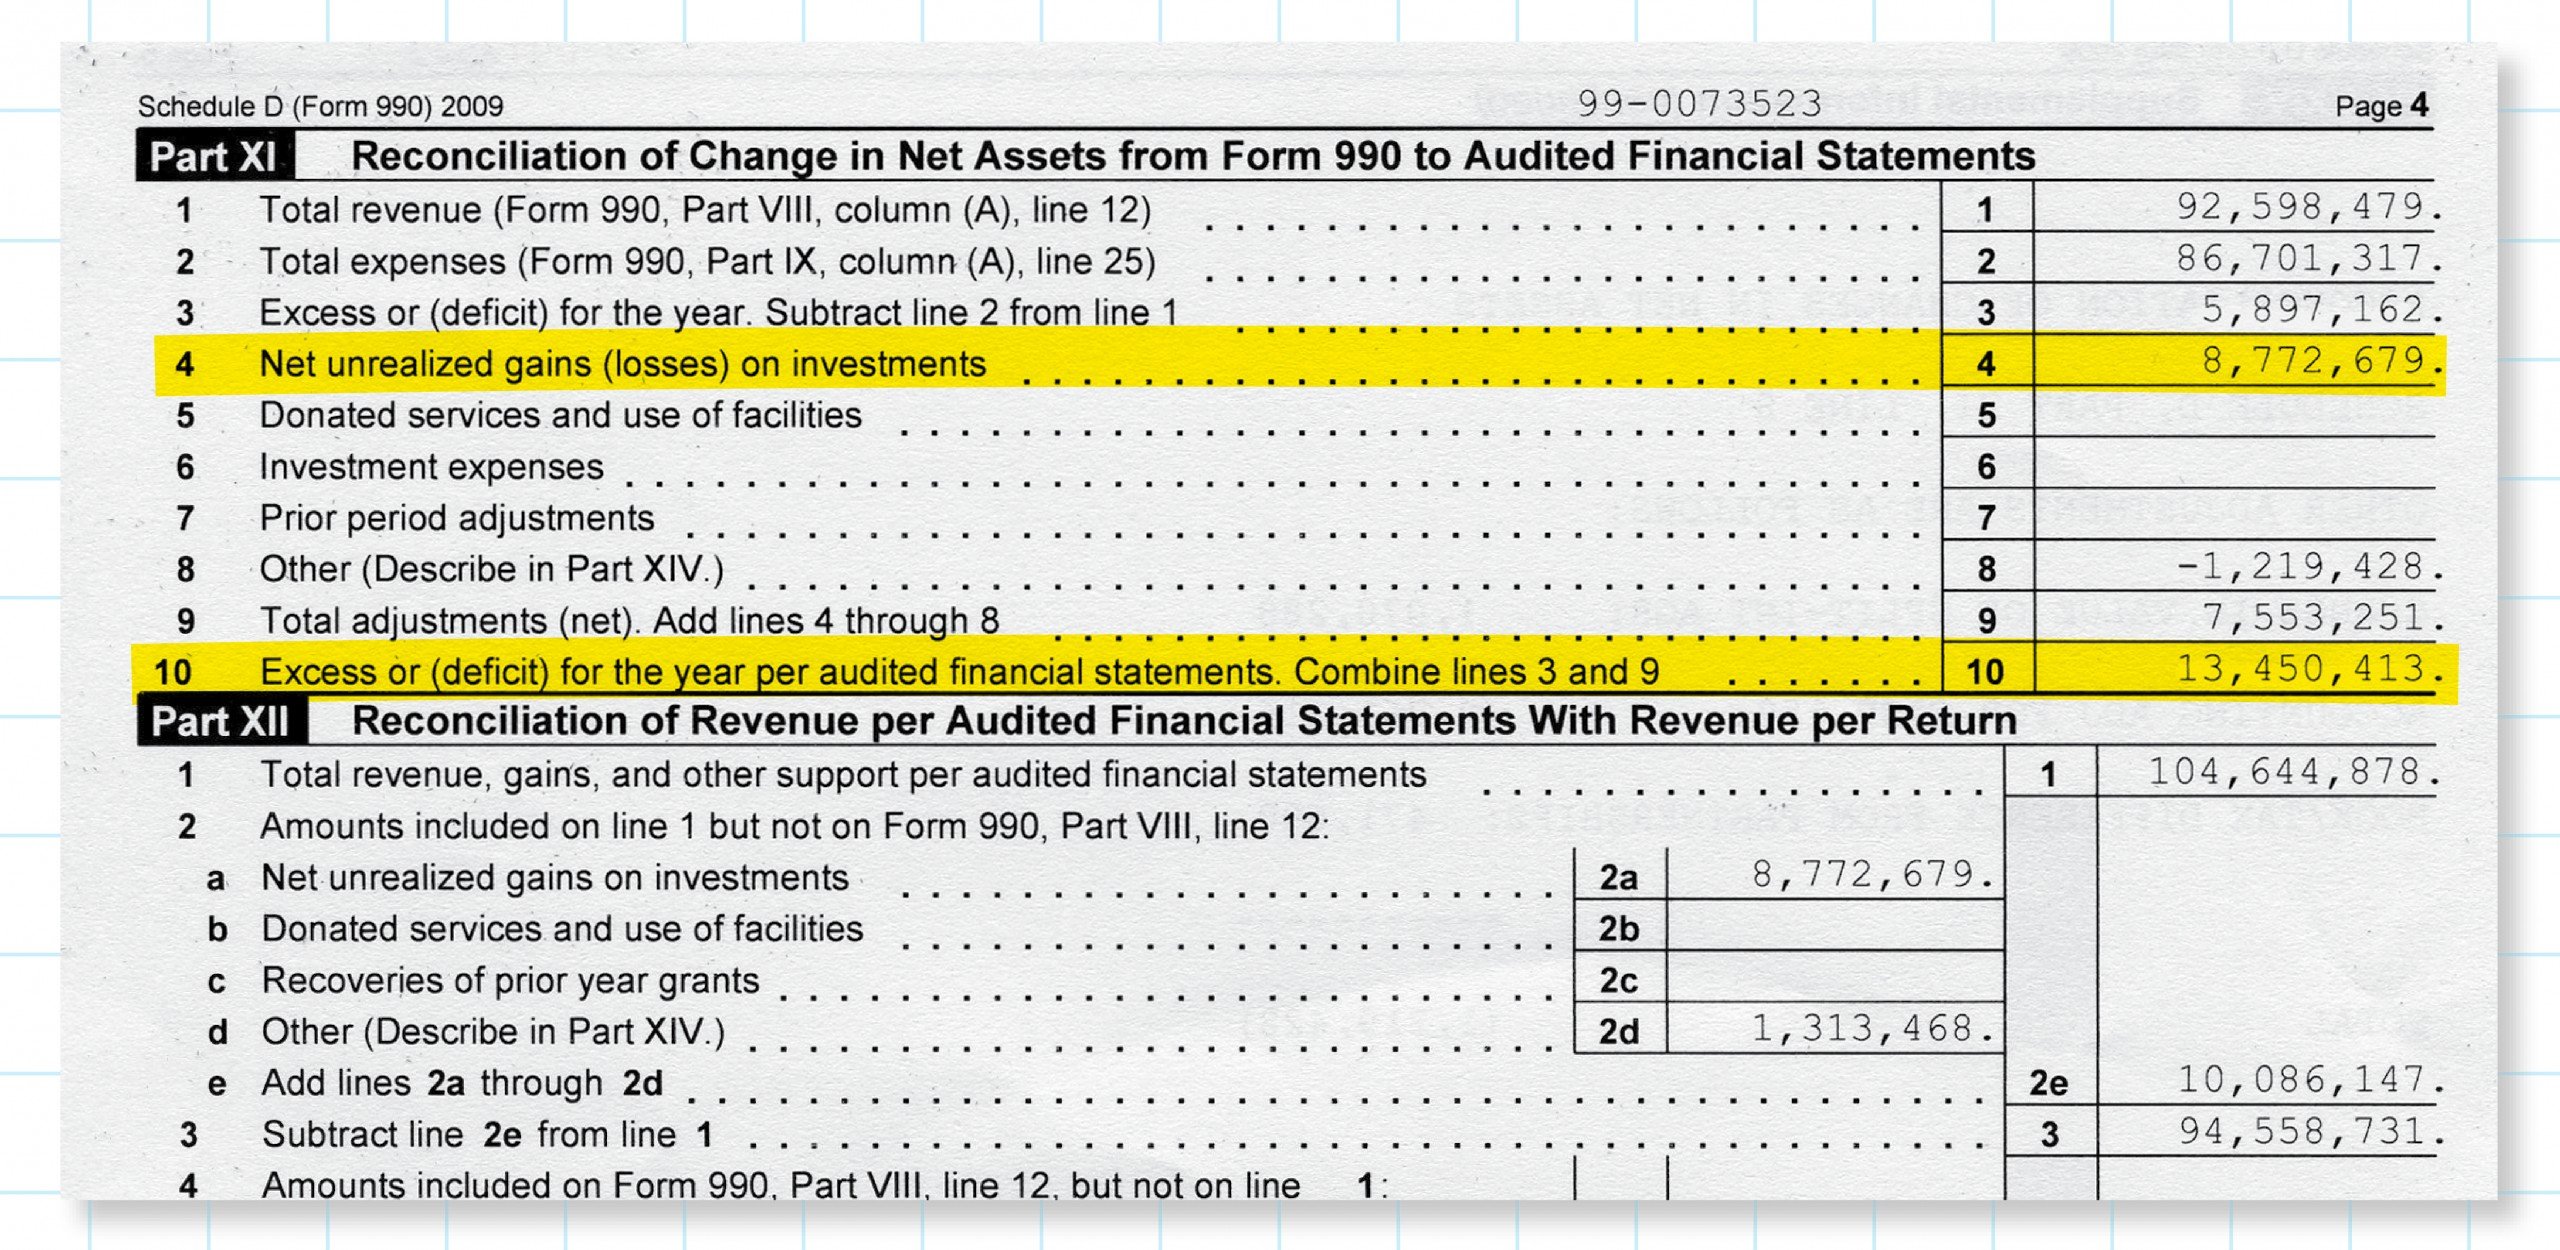
Punahou School
Mark to market rules also affected Punahou School, whose net assets increased $13.45 million in 2010, but $8.8 million of that was unrealized gains. In other words, only about 44 percent was available to spend. A detail from the school’s Schedule D, Part XI, is at right.