GIS in Hawaii
“Past is prologue.”
– William Shakespeare
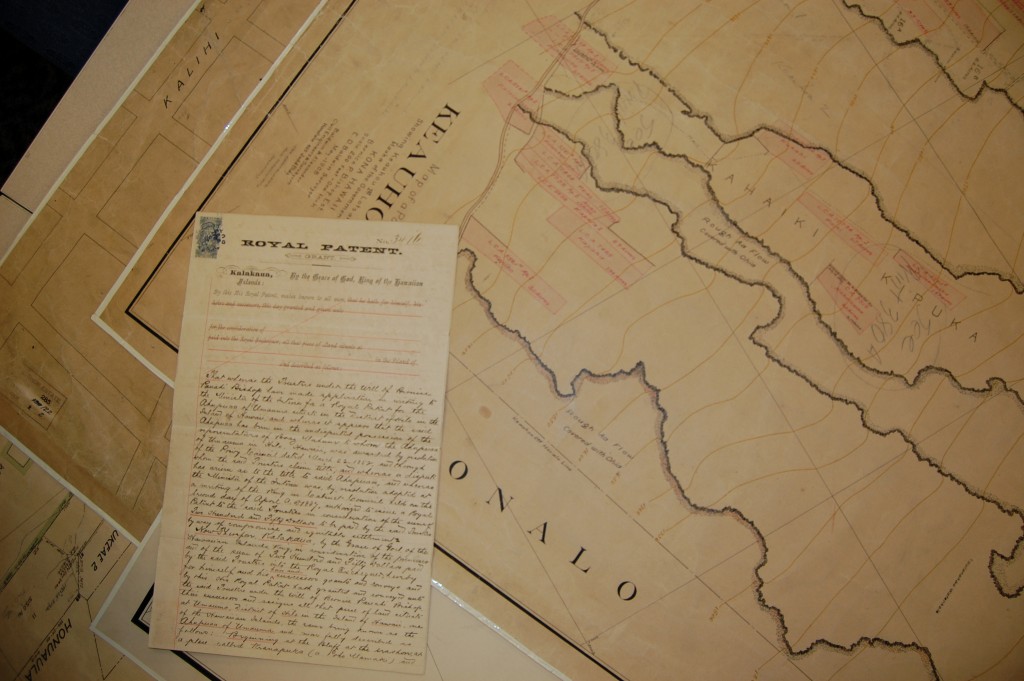
Darrell Hamamura punches his code into a keypad, pulls open the door to the vault and steps back into the past.
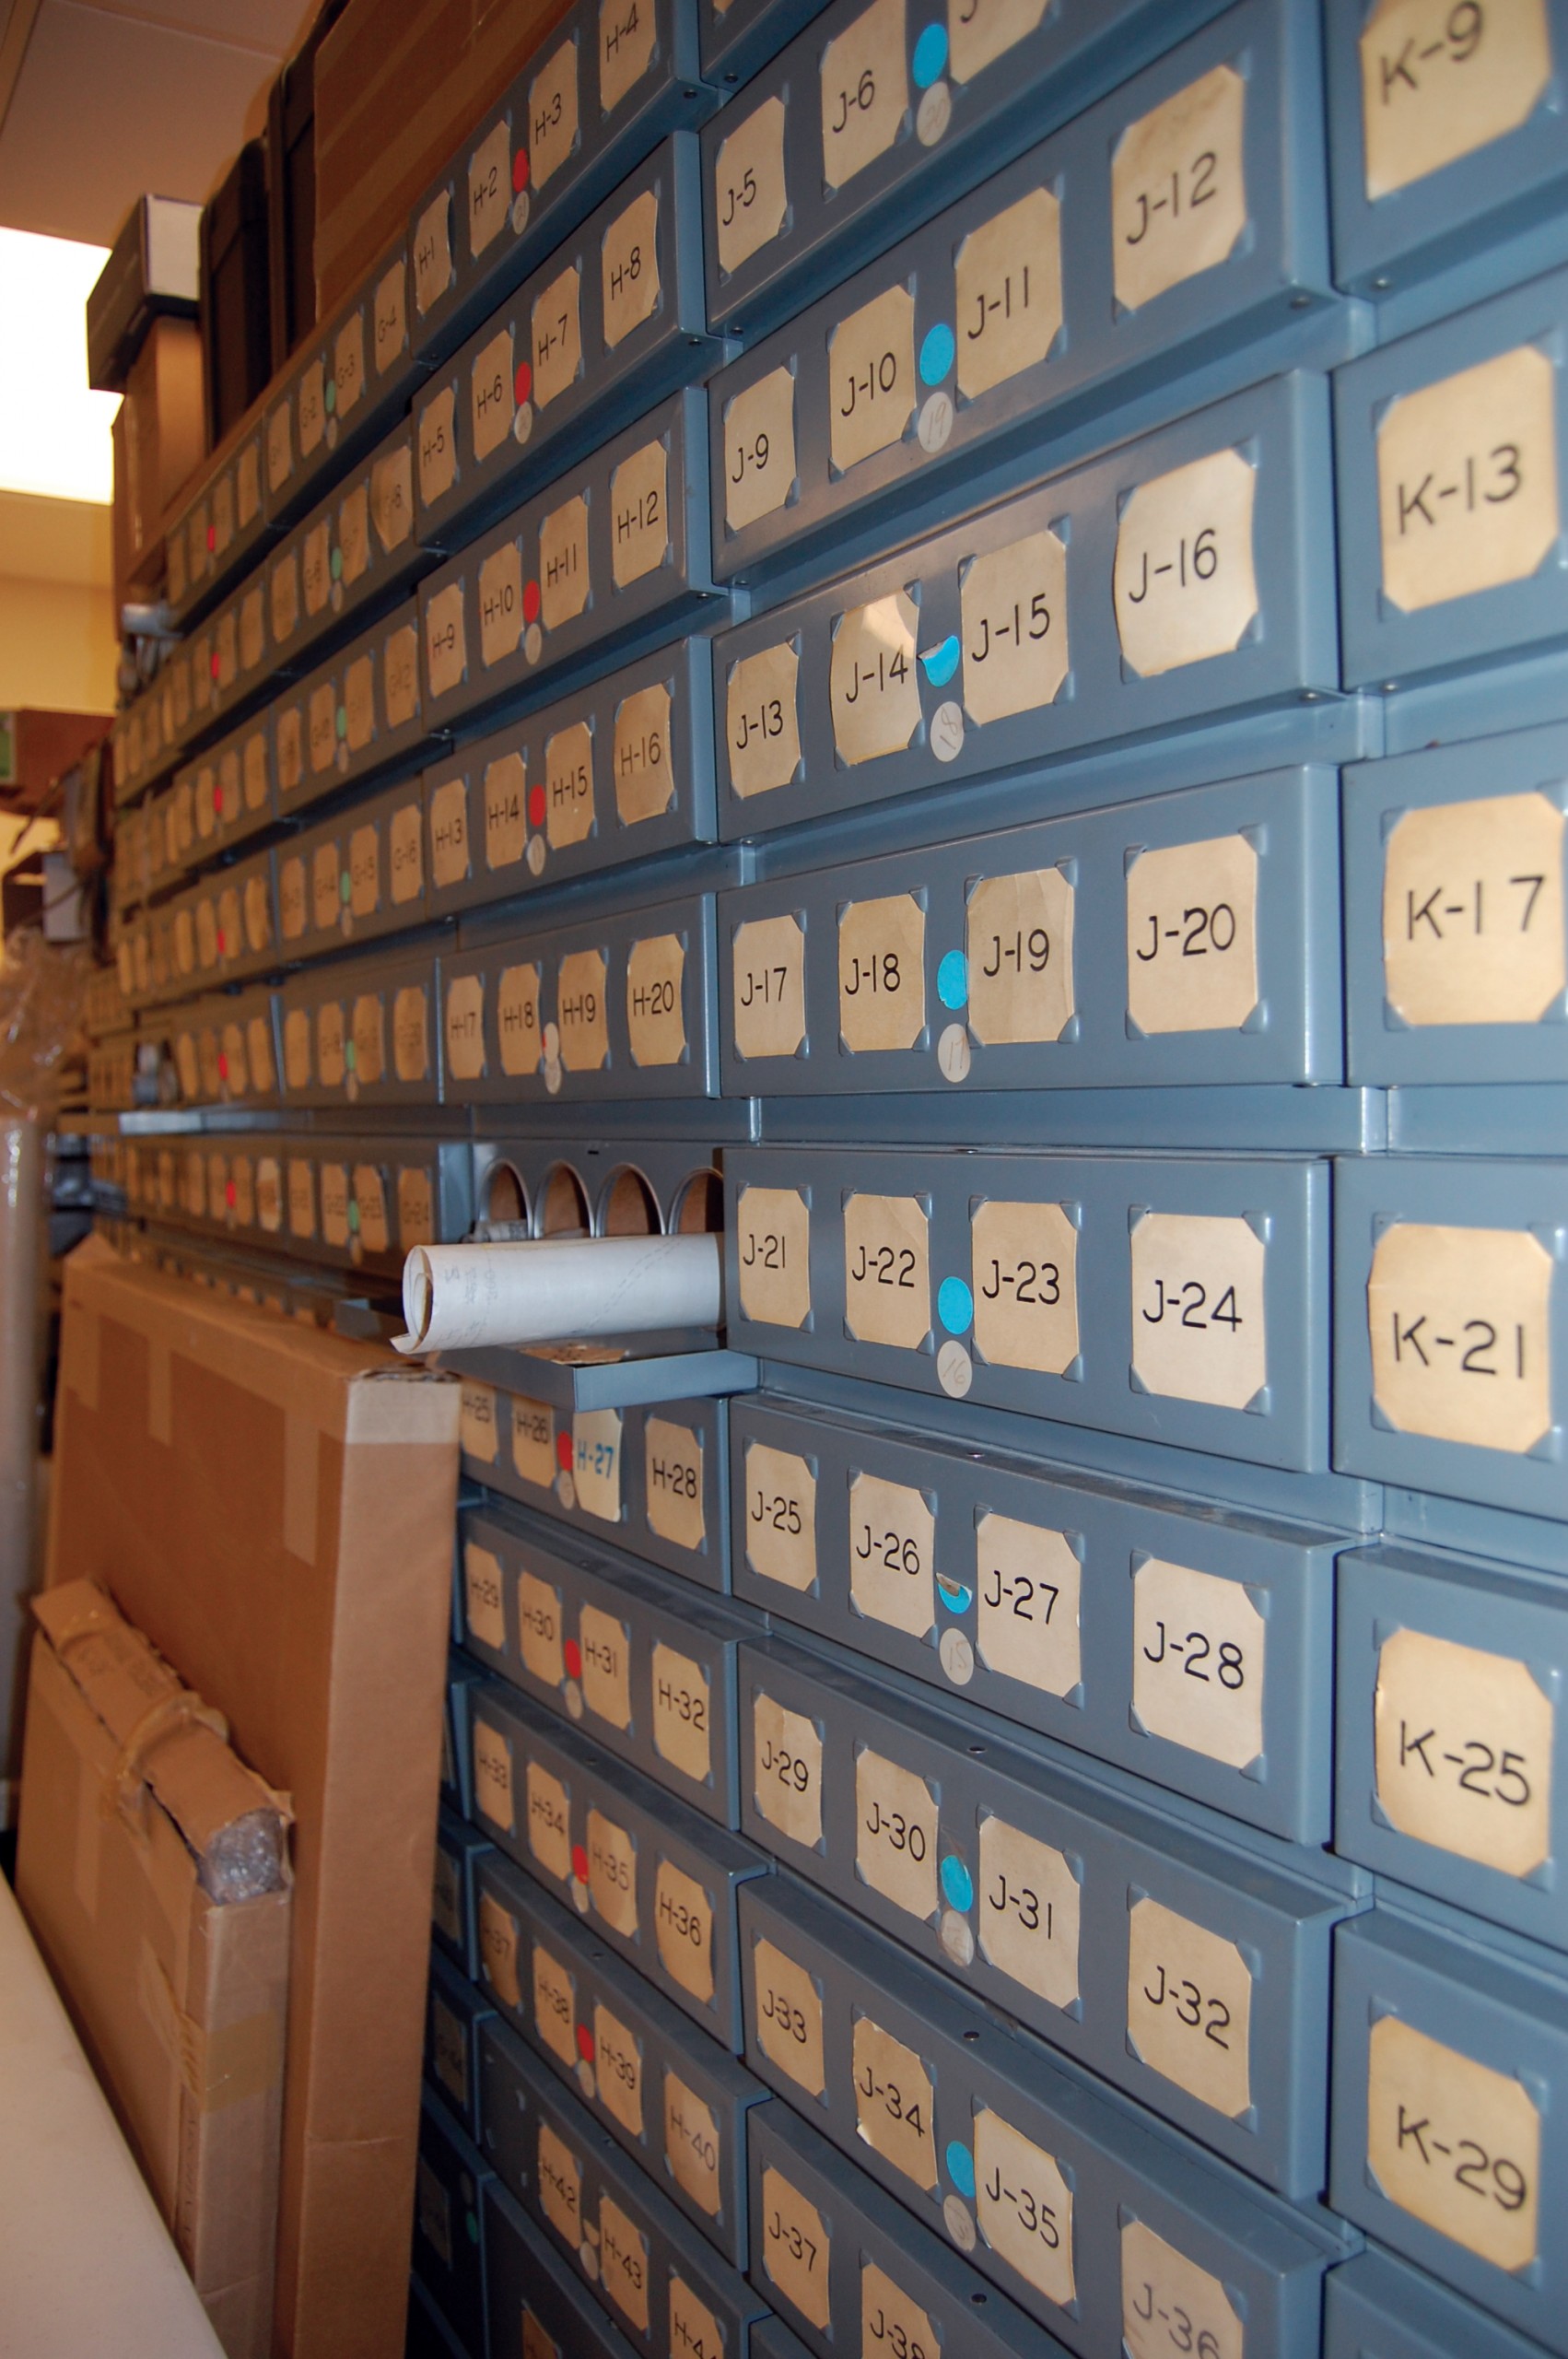
As the land information systems manager for Kamehameha Schools, he tracks the endowment’s vast real estate holdings, more than 365,000 acres of industrial land, retail property, farmland and extensive conservation lands. In the past, that meant poring over some of the thousands of historic documents stored in cabinets along both sides of the vault: titles, deeds and easements; leases and permits; maps and surveys; old photographs and correspondence – the oldest dating back more than 100 years.
Nowadays, Hamamura spends less time in the vault. His work, and the work of many other land planners, developers, architects and others in Hawaii, has become more dependent on a technology called geographic information systems, or GIS. Traditionally, if you wanted to know who owned neighboring parcels, the exact location of underground utilities, or the boundaries of zoning districts, it meant finding the information on a paper map or document in the Kamehameha Schools vault, at the Bureau of Conveyances or in a similar storage room. It was a slow, laborious process. Now, almost all these documents are available from a computer. Not only that, they can be combined with some of the thousands of publicly available maps and databases to help answer complex questions: Is this building in the flood plane? How many people of Hawaiian ancestry live within a 15-minute drive? How much acreage was burned in a recent wildfire? GIS makes all that possible.
It’s not just that GIS speeds up the work of planners, engineers and architects, although it certainly does that. And it’s not simply having more information available, although GIS does that, too. It’s that GIS provides users with a deeper, more intuitive insight into the world around them. To borrow a phrase from the industry, GIS helps decision makers make better decisions.
“Any sufficiently advanced technology is indistinguishable from magic”
– Arthur C. Clark
 GIS systems are a way to store, manipulate and display geospatial information on a computer. That sounds arcane, but if you’ve ever used a service like Google Maps, you’ve worked with a simple GIS. More complicated systems, like ESRI’s ArcDesktop and ArcServer programs, which are used by KSBE, include more data and more sophisticated analytical tools. (Several companies produce GIS software, but the industry is dominated by ESRI.) Indeed, “geospatial information” really just means any data that can be tied to a particular location on a map. This includes obvious things, like addresses and regions, but it also means anything related to that address or region: demographics of the residents, types of land use, elevation, vegetation and much more. In fact, almost all data has some geographic component.
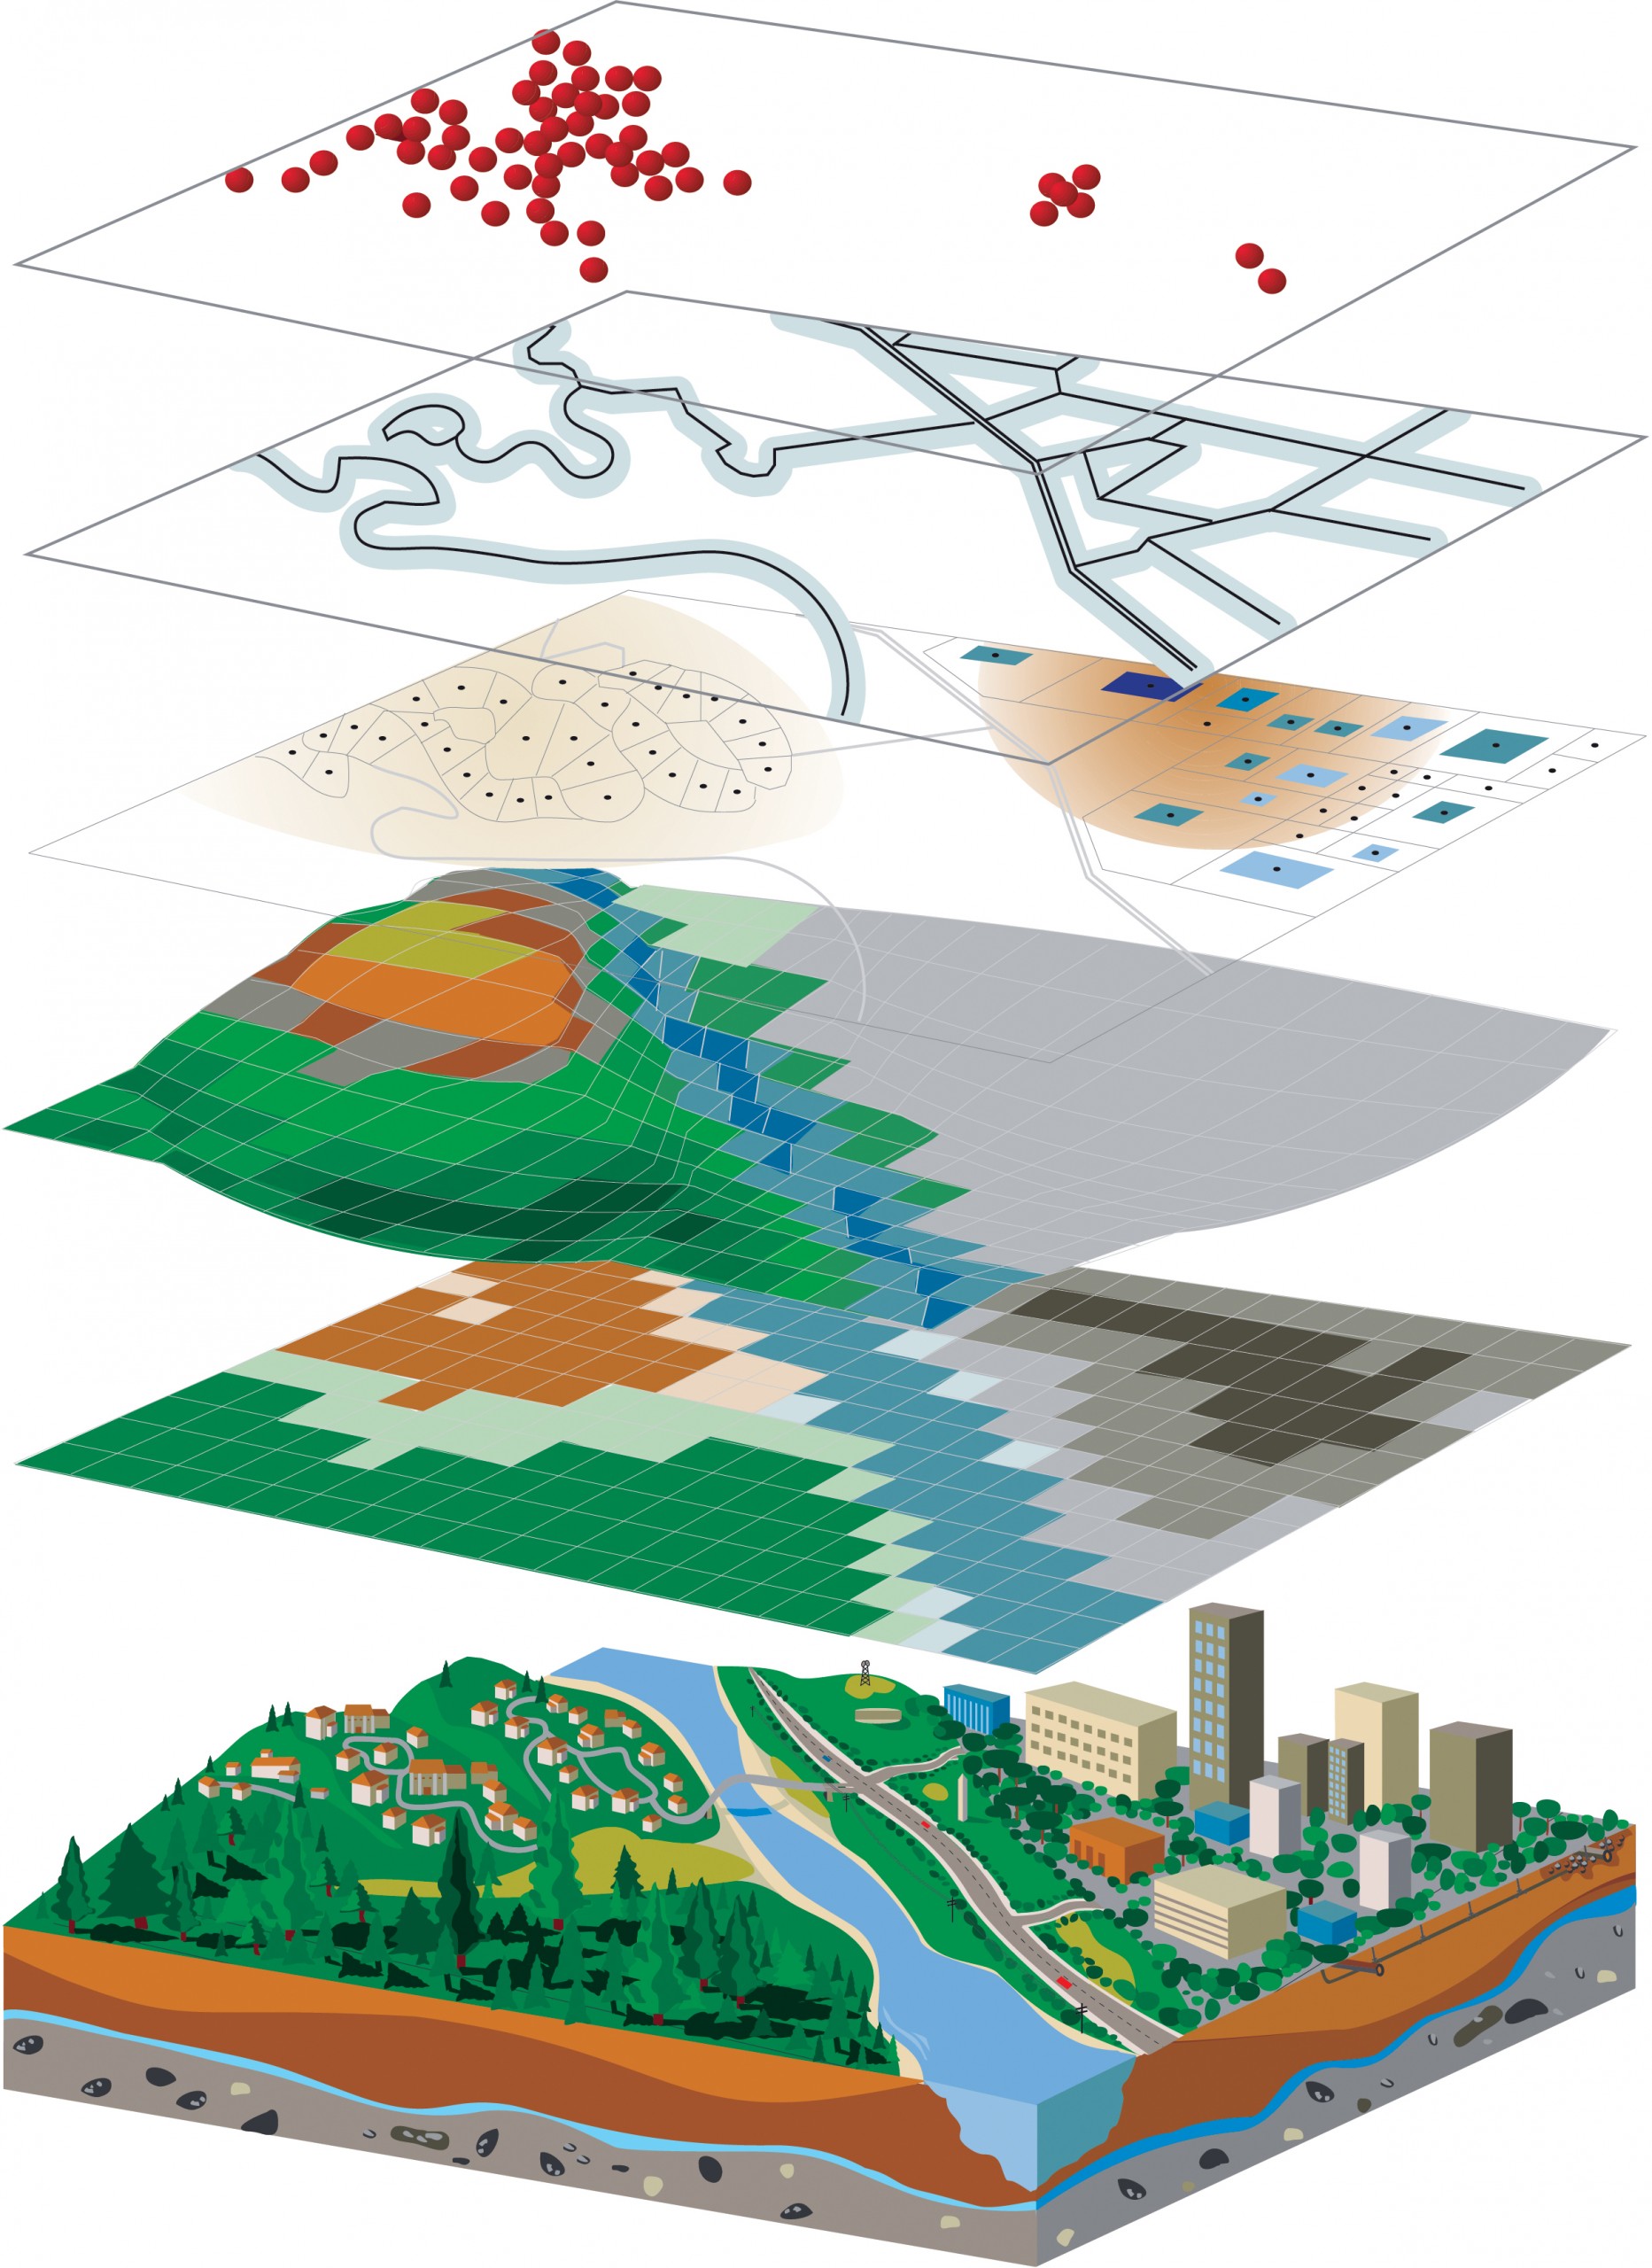
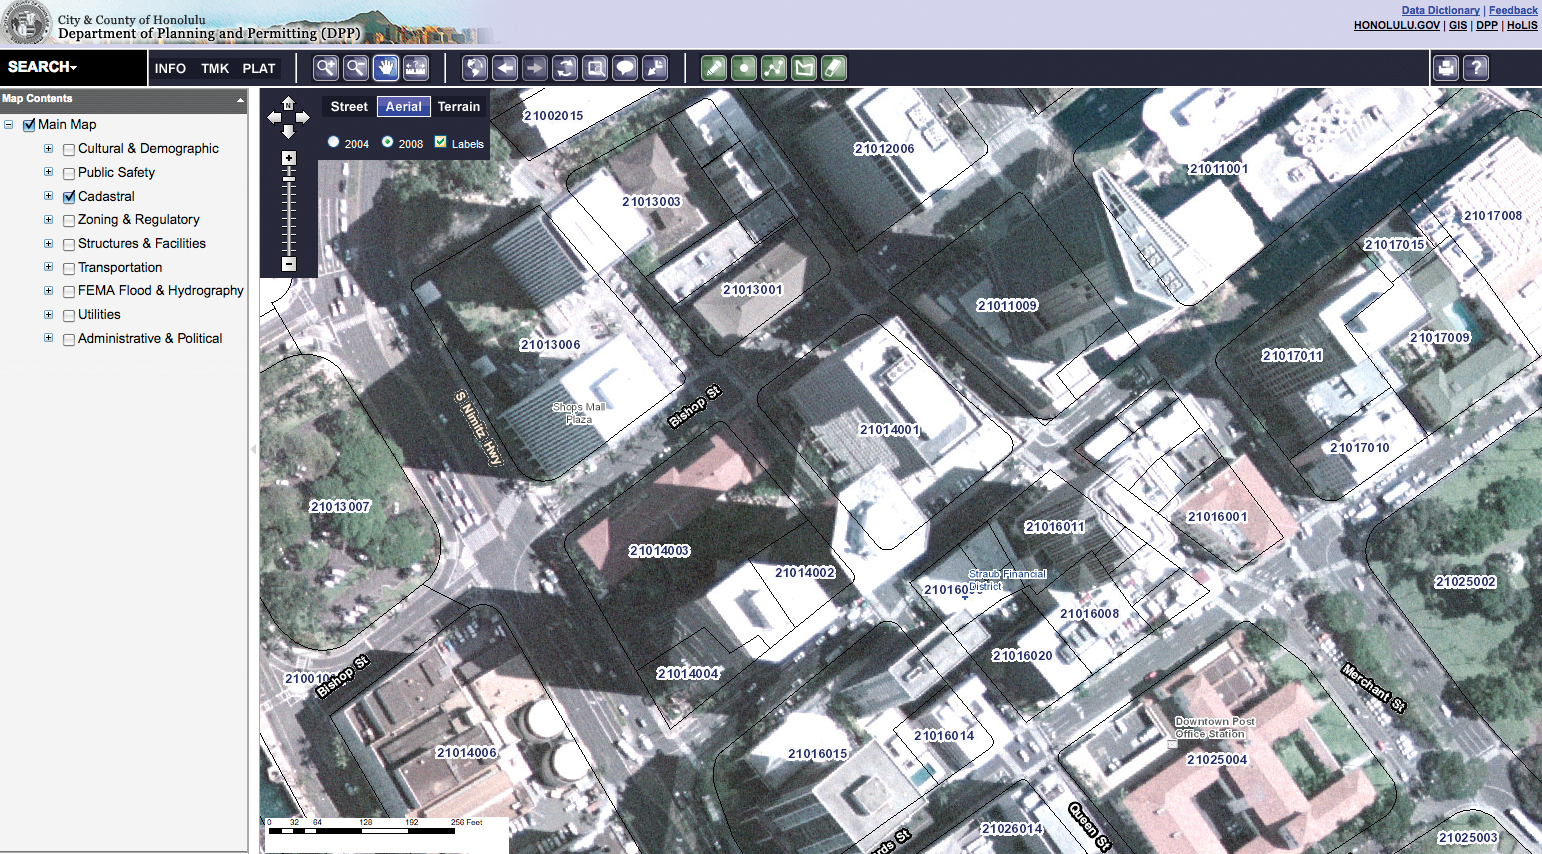
Typically, GIS data is grouped in “layers,” maps of related information that can be laid on top of one another so the user can visualize the relationship between different datasets. This is the real power of GIS. Maps are a powerfully intuitive way to explain and analyze information. Perhaps the best and most useful local example is the City and County of Honolulu’s GIS service at gis.HiCentral.com, which is hosted on the web by the Honolulu Board of Realtors.
Among municipalities, Honolulu is actually in the vanguard of this new technology and much of the credit goes to Ken Schmidt, GIS coordinator for Honolulu’s Department of Planning. For his part, Schmidt attributes the quality of the city’s program to decisions made by his predecessors.
“Honolulu is really one of the earliest adopters of GIS technology at a local-government level,” he says, “especially for a municipality of this size. When you purchase ESRI’s ArcGIS software product, you get assigned a customer number. Honolulu is customer No. 279. Now they’re up to five or six digits in terms of customer numbers.”
Schmidt also credits the city’s decision in 1996 to integrate all departments. “They recognized the importance of having it as an enterprise system. It wasn’t being developed for one particular program or department; it was intended to support all the different services that the city government provides. That was pretty cutting edge back then.” It also ended up saving money and eliminating duplicated efforts.
 Like most municipal GIS systems, Honolulu’s is largely about land use. “For a lot of what we put out,” Schmidt says, “our primary focus was parcel and zoning information, along with other base-map information. Common base-map information includes streets, parcels, building outlines, topography and anything that may have a regulatory influence on a particular property, such as flood zones and zoning designations like special management areas.” All these databases are available directly from the county’s TMK maps. It’s also possible to link to outside sources, like Bing Maps or Google Street View.
With so many flashy programs on the Internet, it’s easy to underestimate an information-rich resource like gis.HiCentral.com. “The big difference between Bing Maps or Google and what the city is producing is the data,” says John Higuchi, program manager for BEI Consulting, which developed Honolulu’s system. The advanced map on gis.HiCentral.com has more than 70 map layers. “The city is the holder of the data. They know where the manholes are; they have the data behind all the parcels and properties; they know the permit information; they know the utilities that are underground. All that information is given to them. Bing and Google don’t have that information, so they’re more directional – how do I get from one address to another.”
The state’s GIS program is more primitive than the City and County’s. The state Office of Planning is the official coordinator of GIS, but it’s never had the funding or support that the city gives Schmidt. Individual departments – especially landowners such as the Department of Transportation and the Department of Land and Natural Resources – are heavy users of GIS, but there’s little coordination in their programs. That may change, because GIS is a major priority of state planning director Jesse Souki. Perhaps more important, Sonny Bhagowalia, the state’s new CIO, has identified a more enterprise-based GIS system as a key way to improve state services. For now, though, state ambitions are constrained by budget woes.
However, the state Office of Planning hosts an astonishing library of free databases and map layers at hawaii.gov/dbedt/gis/. GIS users can visit the site to download hundreds of datasets and maps, including layers that show:
• physical features, like coast lines, rivers and streams, and roads;
• political boundaries, like census blocks, council districts and zoning boundaries;
• natural resources, like agricultural lands, soil maps and wetlands;
• hazard information, like tsunami evacuation zones, emergency shelters and wildfire-risk maps; and
• marine layers, like anchorage areas, bottomfish-restricted areas and explosive dumping areas.
For the neophyte who wants to know why GIS is important, scanning this list of free layers can be an epiphany.
“Information technology and business are becoming inextricably interwoven. I don’t think anyone can talk meaningfully about one without talking about the other.”
– Bill Gates
GIS is already a widely used tool for big businesses in Hawaii and elsewhere. Companies like UPS and FedEx use GIS for routing and scheduling their fleets. GIS, combined with inventory-management tools, allows service providers like Sears to keep track of their rolling inventory, making sure to dispatch a truck that has the right parts on board. Power companies like Hawaiian Electric use GIS to compare the existing electric grid with potential alternative-energy sources to plan infrastructure improvements. In other words, GIS isn’t simply maps, it’s also a powerful analytical and planning tool.
A good example is ESRI’s Business Analyst extension. This add-on to ESRI’s other GIS programs allows companies to take demographic and income data from census blocks and compare that with geographic factors such as available real estate, drive times and zoning maps. Major franchises and big-box stores use this kind of analysis to help locate new stores and coordinate marketing campaigns. That’s because GIS allows businesses to see these kinds of relationships quickly and easily.
GIS’s impact on large local landowners like Kamehameha Schools or A&B Properties may be even more profound. Back in his KS office, Darrell Hamamura uses software called ArcGIS Desktop to pull up the parcel map for Punaluu on Oahu’s Windward coast, where KS owns a lot of land. With a click of his mouse, Hamamura shows how he can retrieve detailed information for any parcel on the map. He can view the property using a topographical map, a roadmap or an aerial image as a basemap. He can zoom in to look at details, or zoom out for a wider perspective. He can use built-in ArcGIS tools to measure distances or calculate acreages on a map. He can also tunnel into different layers that link to a wide assortment of databases, both private and public.
 “Here, I’ll bring up an agricultural layer,” Hamamura says. Then, with a click of his mouse, he selects a parcel from a patchwork of greens and reds and blues. “Here are all the different agricultural fields. These are shape files created using GPS – global positioning system – that identify the boundaries of actual crops and leases. Within this area, we can calculate acreage, give it names, do an inventory of what types of crops are actually being grown. We have a TMK layer, so we can see ownership information on all the neighboring lots.” Perhaps more impressive, from the same map, Hamamura can drill down to another database – Kamehameha Schools’ lease-management system.
“Now we can look at the lease in detail,” he says, zooming in on a small plot in the back of Punaluu. “The system gives you land-asset value; the name of who’s leasing the property; which asset manager manages it; when the lease begins and when it ends; and what it’s leased for – in this case, aquaculture. And it gives you all the other lease information: base rent, any other rent, contact information. For all this information, we’re just using our GIS portal to get to the parcel layer. From there, we’re able to get to all the other systems. That way, the user only has to enter the TMK once.” Or, in this case, simply click on a map.
The point of this demonstration is that a custom GIS program, like KSBE’s, can be modified to include more features than a public portal like
gis.HiCentral.com. For emphasis, Hamamura plunges deeper into the system’s library of databases. “Now, we’re looking at our property-inspection-management system,” he says, pulling up a table of data. “So, for this TMK, we’ve conducted all these inspections. Using GIS, we can look at who the inspector was, what dates he was there, and see the latest inspection report. On this report, for example, the inspector found two problems. Scrolling down on the inspection system, we can see this is from the inspector writing back to the asset manager who works with that lessee.”
Of course, GIS is famously about maps, and the KSBE system is no exception. Hamamura clicks the maps tab to show what that means for asset managers or planners. “We’ve scanned in almost all our Kamehameha Schools maps database,” he says, referring to the collection of maps and surveys in the vault. “So, this is a list of all the maps that are available for this Punaluu area. What you can do is click on an individual map and see all the metadata on it: what it is, who surveyed it and when it was surveyed. In this case, it was in 1885 – and we do have an image.” He clicks on the link, and the 117-year-old map of Punaluu emerges, as clear as if it were spread out on the office table.
“ [(Maps + Data) x Analysis]Web ”
– Royce Jones, providing an equation that explains the power of GIS
According to Royce Jones, ESRI’s Hawaii/Pacific regional manager, the future of GIS is going to be increasingly on the cloud. Part of the reason has to do with the growing influence of web-based map services like those offered by state and federal agencies such as USGS and NOAA. In addition, developers like ESRI are offering new tools – often for free – that make it easier for GIS users to create their own “focused web applications.” Using ESRI’s new, free program at ArcGIS.com, for example, even non-GIS experts can easily create, publish and share simple maps. The program includes high-quality base maps, basic GIS navigation and tools, and the ability to add layers either from your own files or hundreds of web sources. For now, most examples in the Hawaii Ohana section of the website are simple demonstrations. But, Jones points out, it’s also possible to create highly sophisticated and useful focused web applications.
A case in point is the use of editable layers that allow people to add or subtract information from an existing map, and share the new version with the public. Jones gives a couple of examples: The city of Honolulu is experimenting with a service called City Source, through which citizens can alert city officials about problems, like potholes or graffiti, by posting them on a public map. Also, during the recent public hearings about redistricting for the state Senate, the state created a focused web application that allowed citizens to redraw their district boundaries, moving census blocks back and forth between districts to create their own redistricting plans. The program allowed them to see instantly what effects these changes would have on district populations and whether their plans met legal guidelines. In the end, they could save their changes and submit their plans as official testimony to the commission.
“Part of ‘to the power of the web,’ ” Jones says, “goes the other direction. We tend to think of GIS as pushing information out to the public by the City and County, but what about getting information back?” That, too, is the future of GIS in Hawaii.
Maybe the most important effect of the Web is that it’s making GIS affordable to smaller companies. Until now, software like ESRI’s ArcGIS Server cost as much as $7,000 per user and there was the even bigger cost of maintaining a server. “Smaller businesses, and even some smaller government agencies, don’t really have an IT shop that could run a server that could handle public requests and so forth,” Jones says.
But GIS, like everything else, is going to the cloud. Organizations no longer need to marshal a full IT department to offer maps or focused web applications to the public. “People go to redistricting.hawaii.gov,” Jones says, “but it’s actually hosted on Amazon. You can now have your own server, but you don’t have to administer it.”
In the end, GIS is ubiquitous. The growth of the Internet and the proliferation of web-based map services like Google Maps serve both to accelerate that ubiquity and to make it invisible. “Does that mean the GIS professional is going away?” Jones asks. “No. But it’s opened up GIS to the point that it’s just another tool. Now, the end user going through the Web doesn’t even know they’re using GIS.”
There’s one more effect of Jones’ exponential equation using “to the power of the Web.” It’s the inexorable movement toward transparent and publicly available data. Nowadays, almost every government agency tells at least part of its story in a public layer or a database accessible through GIS. This has given rise to an unprecedented cascade of government information into private hands. Private data isn’t far behind. That means GIS will only become a more powerful tool for everyone. The doors to the vault are open.